
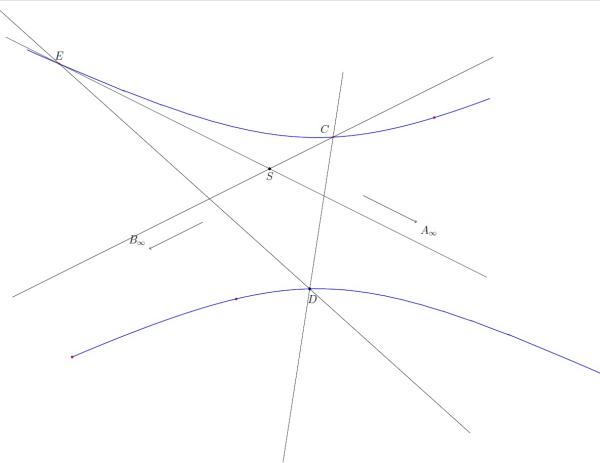
Da mir das Board schon sehr häufig helfen konnte, dieses Mal aber keine Frage zu meinem Problem passt, stelle ich hiermit meine aller erste Frage in die Runde. Ich hoffe, dass der Quellcode als Beispiel funktioniert. Es geht darum, dass ich die Fläche vom Punkt D aus, entlang der Linie DE bis zum nächsten Schnittpunkt und von dort Entlang der Linie Richtung B Einfärben will, allerdings soll der Blaue Pfad durch D diese Fläche nach unten begrenzen. Das gleiche möchte ich dann auch rechts tun, hier allerdings Richtung Punkt A. Also würde ich das Problem wie folgt beschreiben: Ich möchte eine Fläche oberhalb eines Pfades einfärben, welche nach oben und zu einer Seite begrenzt ist durch jeweils einen weiteren Pfad. \documentclass[12pt]{standalone} \usepackage[ansinew]{inputenc} \usepackage[T1]{fontenc} \usepackage[ngerman]{babel} \usepackage{tikz} \usetikzlibrary{intersections,angles,quotes,calc,through,babel} \usepackage{pgfplots} \usepackage{xcolor} \pagestyle{empty} \begin{document} \begin{tikzpicture} %Koordinaten \coordinate (D) at (0,0); \coordinate (S) at ($(D)+(-1,3)$); \coordinate (S1) at ($(D)+1.5*(-1,3)$); \coordinate (A) at ($(S)-(-3,-0.5)$); \coordinate (B) at ($(S)+(-3,-0.5)$); \coordinate (RA) at (2,-1); %Verschiebungsrichtung von A ins Unendliche \coordinate (A1) at ($(A)+(RA)$); \coordinate (RB) at (-2,-1); %Verschiebungsrichtung von B ins Unendliche \coordinate (B1) at ($(B)+(RB)$); \coordinate (D1) at ($(D)+0.25*(1,6.5)$); \coordinate (D2) at ($(D)+(-2,1.8)$); \draw ($(D)!5!(D1)$)--($(D1)!5!(D)$); \draw ($(D)!6!(D2)$)--($(D2)!4!(D)$); \fill (S1) circle (1.5pt); \node[anchor=north] at(S1){$S$}; \node[anchor=north] at($(D)-(-0.1,0.1)$){$D$}; \fill (D) circle (1.5pt); \draw[->] (A)--(A1); \node[anchor=north west]at(A1){$A_{\infty}$}; \draw[->] (B)--(B1); \node[anchor=south east]at(B1){$B_{\infty}$}; \foreach \i in {-40,...,13}{ \coordinate (Q) at ($(D)!0.1*\i!(D1)$); \coordinate (Q1) at (intersection of D--D2 and Q--S1); \coordinate (P\i) at (intersection of {$(Q)+(RA)$}--Q and {$(Q1)+(RB)$}--Q1); } \foreach \i in {21,...,60}{ \coordinate (Q) at ($(D)!0.1*\i!(D1)$); \coordinate (Q1) at (intersection of D--D2 and Q--S1); \coordinate (P\i) at (intersection of {$(Q)+(RA)$}--Q and {$(Q1)+(RB)$}--Q1); } \foreach \i in {-40,-10,50}{\fill[red] (P\i) circle (1.3pt);} \draw [blue, thick,name path=line1] plot [smooth, tension=2] coordinates {(P-40) (P-39) (P-38) (P-37) (P-36) (P-35) (P-34) (P-33) (P-32) (P-31) (P-30) (P-29) (P-28) (P-27) (P-26) (P-25) (P-24) (P-23) (P-22) (P-21) (P-20) (P-19) (P-18) (P-17) (P-16) (P-15) (P-14) (P-13) (P-12) (P-11) (P-10) (P-9) (P-8) (P-7) (P-6) (P-5) (P-4) (P-3) (P-2) (P-1) (P0) (P1) (P2) (P3) (P4) (P5) (P6) (P7) (P8) (P9) (P10) (P11) (P12) (P13) }; \draw [blue, thick] plot [smooth, tension=2] coordinates {(P21) (P22) (P23) (P24) (P25) (P26) (P27) (P28) (P29) (P30) (P31) (P32) (P33) (P34) (P35) (P36) (P37) (P38) (P39) (P40) (P41) (P42) (P43) (P44) (P45) (P46) (P47) (P48) (P49) (P50) (P51) (P52) (P53) (P54) (P55) (P56) (P57) (P58) (P59) (P60)}; \coordinate (C) at (intersection of {$(S1)+(RB)$}--S1 and D--D1); \coordinate (E) at (intersection of {$(S1)+(RA)$}--S1 and D--D2); \fill[red] (C) circle (1pt); \fill[red] (E) circle (1pt); \node[anchor=south east] at (C){$C$}; \node[anchor=south] at (E){$E$}; \draw ($(C)-3*(RB)$)--($(C)+6*(RB)$); \draw ($(E)-(RA)$)--($(E)+8*(RA)$); \end{tikzpicture} \end{document}
Ich würde mich sehr freuen, wenn jemand von euch eine Lösungsidee hätte! |
Die Frage wurde aus folgenden Grund "Duplikat einer anderen Frage" geschlossen saputello 13 Sep '17, 15:19
|
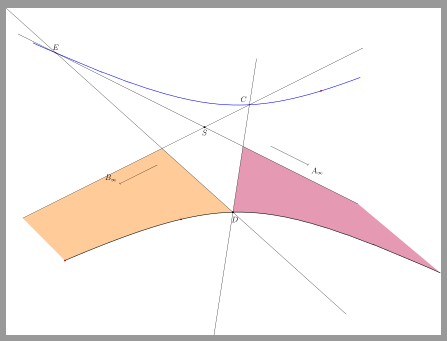
Das ist eigentlich ein Duplikat zu Wie kann ich die Fläche zwischen mehreren Pfaden füllen?. Die dortige Antwort von @cfeuersaenger übertragen auf Deine Frage liefert (vorausgesetzt, ich habe richtig verstanden, was gefärbt werden soll):
Code: \documentclass[12pt]{standalone} \usepackage[ansinew]{inputenc} \usepackage[T1]{fontenc} \usepackage[ngerman]{babel} \usepackage{pgfplots} \pgfplotsset{compat=1.13} \usepgfplotslibrary{fillbetween} \usetikzlibrary{intersections,angles,quotes,calc,through,babel} \pagestyle{empty} \begin{document} \begin{tikzpicture} \pgfdeclarelayer{pre main} \pgfsetlayers{pre main,main} %Koordinaten \coordinate (D) at (0,0); \coordinate (S) at ($(D)+(-1,3)$); \coordinate (S1) at ($(D)+1.5*(-1,3)$); \coordinate (A) at ($(S)-(-3,-0.5)$); \coordinate (B) at ($(S)+(-3,-0.5)$); \coordinate (RA) at (2,-1); %Verschiebungsrichtung von A ins Unendliche \coordinate (A1) at ($(A)+(RA)$); \coordinate (RB) at (-2,-1); %Verschiebungsrichtung von B ins Unendliche \coordinate (B1) at ($(B)+(RB)$); \coordinate (D1) at ($(D)+0.25*(1,6.5)$); \coordinate (D2) at ($(D)+(-2,1.8)$); \draw[name path=CD] ($(D)!5!(D1)$)--($(D1)!5!(D)$); \draw[name path=ED] ($(D)!6!(D2)$)--($(D2)!4!(D)$); \fill (S1) circle (1.5pt); \node[anchor=north] at(S1){$S$}; \node[anchor=north] at($(D)-(-0.1,0.1)$){$D$}; \fill (D) circle (1.5pt); \draw[->] (A)--(A1); \node[anchor=north west]at(A1){$A_{\infty}$}; \draw[->] (B)--(B1); \node[anchor=south east]at(B1){$B_{\infty}$}; \foreach \i in {-40,...,13}{ \coordinate (Q) at ($(D)!0.1*\i!(D1)$); \coordinate (Q1) at (intersection of D--D2 and Q--S1); \coordinate (P\i) at (intersection of {$(Q)+(RA)$}--Q and {$(Q1)+(RB)$}--Q1); } \foreach \i in {21,...,60}{ \coordinate (Q) at ($(D)!0.1*\i!(D1)$); \coordinate (Q1) at (intersection of D--D2 and Q--S1); \coordinate (P\i) at (intersection of {$(Q)+(RA)$}--Q and {$(Q1)+(RB)$}--Q1); } \foreach \i in {-40,-10,50}{\fill[red] (P\i) circle (1.3pt);} \draw [thick,name path=line1] plot [smooth, tension=2] coordinates {(P-40) (P-39) (P-38) (P-37) (P-36) (P-35) (P-34) (P-33) (P-32) (P-31) (P-30) (P-29) (P-28) (P-27) (P-26) (P-25) (P-24) (P-23) (P-22) (P-21) (P-20) (P-19) (P-18) (P-17) (P-16) (P-15) (P-14) (P-13) (P-12) (P-11) (P-10) (P-9) (P-8) (P-7) (P-6) (P-5) (P-4) (P-3) (P-2) (P-1) (P0) (P1) (P2) (P3) (P4) (P5) (P6) (P7) (P8) (P9) (P10) (P11) (P12) (P13) }; \draw [blue, thick] plot [smooth, tension=2] coordinates {(P21) (P22) (P23) (P24) (P25) (P26) (P27) (P28) (P29) (P30) (P31) (P32) (P33) (P34) (P35) (P36) (P37) (P38) (P39) (P40) (P41) (P42) (P43) (P44) (P45) (P46) (P47) (P48) (P49) (P50) (P51) (P52) (P53) (P54) (P55) (P56) (P57) (P58) (P59) (P60)}; \coordinate (C) at (intersection of {$(S1)+(RB)$}--S1 and D--D1); \coordinate (E) at (intersection of {$(S1)+(RA)$}--S1 and D--D2); \fill[red] (C) circle (1pt); \fill[red] (E) circle (1pt); \node[anchor=south east] at (C){$C$}; \node[anchor=south] at (E){$E$}; \draw[name path=CB] ($(C)-3*(RB)$)--($(C)+6*(RB)$); \draw[name path=EA] ($(E)-(RA)$)--($(E)+8*(RA)$); %%% \path[%draw,line width=3,orange, name path=EDandCB, intersection segments={ of=ED and CB, sequence={A1 -- B1} } ]; \path[%draw,line width=3,purple, name path=EAandCD, intersection segments={ of=EA and CD, sequence={A1[reverse] -- B1} } ]; \pgfonlayer{pre main} \fill [ orange!40!white, intersection segments={ of=EDandCB and line1, sequence={A1 -- B0} } ]; \fill [ purple!40!white, intersection segments={ of=EAandCD and line1, sequence={A0--B1} } ]; \endpgfonlayer \end{tikzpicture} \end{document} Genau das will ich tun, esdd! Vielen vielen Dank! Entschuldigt bitte den Doppelpost, aber ich habe es in dem anderen Thread nicht wirklich geblickt. :( Wie kann ich die Frage als beantwortet schließen?
(11 Mär '16, 15:01)
Wienie2401
Ich habe Deine "Antwort" in einen Kommentar umgewandelt. Hier sind Antworten stets "echte" Antworten, keine Gespräche oder Rückfragen oder Zusatzinfos, sondern Lösungen. Editieren der Frage ist jederzeit möglich und erwünscht. Das verbessert die Übersicht erheblich für die Archivierung der Lösungen. Ungewohnt und anders als in Webforen, doch innovativ und nutzbarer. Bemerkungen gern wie hier als Kommentare.
(11 Mär '16, 15:03)
esdd
|

Das dürfte ein Duplikat zu Wie kann ich die Fläche zwischen mehreren Pfaden füllen? sein.