
|
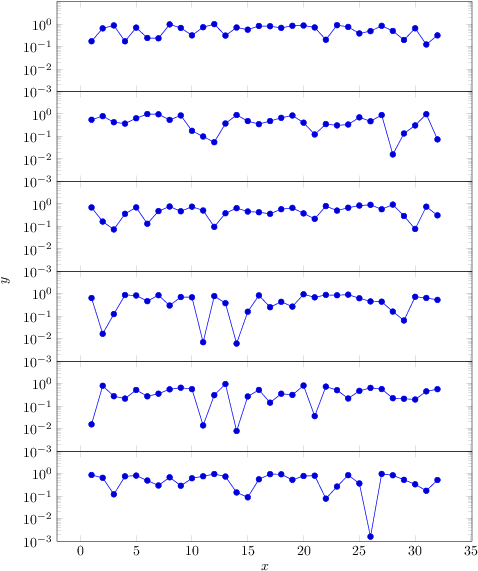
Hallo, nachdem ich mir schon habe helfen lassen, besteht mein Problem bei folgendem Diagramm nun noch darin, nur eine zentrierte y-Achsenbeschriftung hinzubekommen (Ihr seht was ich meine wenn ihr kompiliert.). Hier der Code: \RequirePackage{filecontents} \begin{filecontents}{\jobname Data.asc} 1 0.17115 0.55394 0.6971 0.65344 0.0157 0.87929 2 0.64238 0.80191 0.16366 0.01668 0.81783 0.65905 3 0.86885 0.42977 0.07315 0.12626 0.28043 0.12131 4 0.17057 0.37244 0.36153 0.88735 0.21955 0.76788 5 0.69336 0.64593 0.70009 0.84742 0.53193 0.82532 6 0.24054 0.99533 0.13096 0.47399 0.27708 0.49837 7 0.23183 0.96818 0.48013 0.86949 0.36314 0.3001 8 0.96543 0.54497 0.76546 0.30264 0.5689 0.69436 9 0.67137 0.86029 0.46995 0.72206 0.66963 0.29152 10 0.31333 0.17796 0.75349 0.70197 0.57946 0.62873 11 0.72244 0.09963 0.51003 0.00707 0.01407 0.77102 12 0.98973 0.0555 0.09534 0.7955 0.3129 0.96739 13 0.30684 0.37776 0.38395 0.3854 0.97732 0.74938 14 0.70189 0.90036 0.64864 0.00615 0.00795 0.1469 15 0.56224 0.48462 0.45916 0.16076 0.27302 0.08922 16 0.82157 0.35318 0.4257 0.85515 0.53443 0.56506 17 0.80047 0.48567 0.36371 0.25489 0.14471 0.95966 18 0.6753 0.6737 0.5821 0.44261 0.36274 0.94253 19 0.83784 0.85743 0.66605 0.27026 0.32058 0.53512 20 0.8599 0.41089 0.37954 0.95858 0.83585 0.79425 21 0.70561 0.12291 0.21715 0.69932 0.0365 0.81971 22 0.20045 0.35562 0.80136 0.89809 0.74951 0.07787 23 0.89233 0.31063 0.50437 0.86666 0.52082 0.26937 24 0.74551 0.33981 0.67794 0.92183 0.22209 0.86333 25 0.38234 0.70897 0.84522 0.63723 0.48372 0.36959 26 0.48319 0.47456 0.90873 0.46162 0.65766 0.00159 27 0.83438 0.89913 0.57955 0.4483 0.58212 0.98116 28 0.49274 0.0159 0.93168 0.16264 0.22853 0.85393 29 0.19568 0.13576 0.29019 0.06538 0.21641 0.5337 30 0.6472 0.30968 0.07699 0.73935 0.20007 0.33851 31 0.12317 0.98203 0.75305 0.65892 0.461 0.17464 32 0.31406 0.07436 0.31047 0.53947 0.57473 0.5266 \end{filecontents} \documentclass{article} \usepackage{pgfplots} \usetikzlibrary{pgfplots.groupplots} \pgfplotsset{compat=1.10} \begin{document} \begin{tikzpicture} \begin{groupplot}[ group style={ group name=my plots, group size=1 by 6, xlabels at=edge bottom, xticklabels at=edge bottom, ylabels at=edge left, yticklabels at=edge left, vertical sep=0pt, }, ymin = 0.001, ymax = 10, ytick = {0.001,0.01,0.1,1}, ylabel={$y$}, xlabel={$x$}, width=\textwidth, height=0.2\textheight, ymode=log, ] \nextgroupplot \addplot table {\jobname Data.asc}; \nextgroupplot \addplot table [y index=2] {\jobname Data.asc}; \nextgroupplot \addplot table [y index=3] {\jobname Data.asc}; \nextgroupplot \addplot table [y index=4] {\jobname Data.asc}; \nextgroupplot \addplot table [y index=5] {\jobname Data.asc}; \nextgroupplot \addplot table [y index=6] {\jobname Data.asc}; \end{groupplot} \end{tikzpicture} \end{document} Danke schonmal! :-) |
|
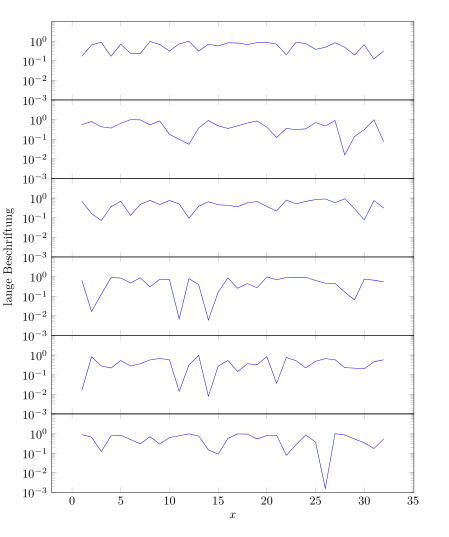
Ich habe auch noch eine Variante zu bieten, bei der keine Ausrichtung von Hand notwendig ist. Die Beschriftung wird mit dem \documentclass{article} \usepackage{pgfplots} \usetikzlibrary{pgfplots.groupplots} \pgfplotsset{compat=1.9} \begin{document} \begin{tikzpicture} \begin{groupplot}[ group style={ group name=my plots, group size=1 by 6, xlabels at=edge bottom, xticklabels at=edge bottom, ylabels at=edge left, yticklabels at=edge left, vertical sep=0pt, }, ymin = 0.001, ymax = 10, ytick = {0.001,0.01,0.1,1}, xlabel={$x$}, width=\textwidth, height=0.2\textheight, ymode=log, no markers% keine "Punkte" ] \nextgroupplot \addplot table {\jobname Data.asc}; \coordinate (left top) at (rel axis cs:0,1); \nextgroupplot \addplot table [y index=2] {\jobname Data.asc}; \nextgroupplot \addplot table [y index=3] {\jobname Data.asc}; \nextgroupplot \addplot table [y index=4] {\jobname Data.asc}; \nextgroupplot \addplot table [y index=5] {\jobname Data.asc}; \nextgroupplot \addplot table [y index=6] {\jobname Data.asc}; \coordinate (left bot) at (rel axis cs:0,0); \end{groupplot} \path (left top-|current bounding box.west)-- node[anchor=south,rotate=90] {lange Beschriftung} (left bot-|current bounding box.west); \end{tikzpicture} \end{document}
Super! Jetzt hab ich noch alles schwarz gemacht und geglättet und nun sieht das genau ao aus wie ich will. Also wenn die Legende dran ist. Aber das krieg ich bestimmt hin. ;-)
(17 Jul '14, 16:48)
lorbj
Haha, jetzt seh ich erst, dass die Punkte in Anführungsstrichen stehen. Selbstverständlich hast du recht, es sind ja Kreise. Ist hier ein Mathematiker am Werk? ;-)
(18 Jul '14, 09:05)
lorbj
|
|
Ich hab den Abstand zwischen der oberen linken und der unteren linken Ecke genommen und in der Mitte das y platziert. Als y-Achsebeschriftung habe ich ein \RequirePackage{filecontents} \begin{filecontents}{\jobname Data.asc} 1 0.17115 0.55394 0.6971 0.65344 0.0157 0.87929 2 0.64238 0.80191 0.16366 0.01668 0.81783 0.65905 3 0.86885 0.42977 0.07315 0.12626 0.28043 0.12131 4 0.17057 0.37244 0.36153 0.88735 0.21955 0.76788 5 0.69336 0.64593 0.70009 0.84742 0.53193 0.82532 6 0.24054 0.99533 0.13096 0.47399 0.27708 0.49837 7 0.23183 0.96818 0.48013 0.86949 0.36314 0.3001 8 0.96543 0.54497 0.76546 0.30264 0.5689 0.69436 9 0.67137 0.86029 0.46995 0.72206 0.66963 0.29152 10 0.31333 0.17796 0.75349 0.70197 0.57946 0.62873 11 0.72244 0.09963 0.51003 0.00707 0.01407 0.77102 12 0.98973 0.0555 0.09534 0.7955 0.3129 0.96739 13 0.30684 0.37776 0.38395 0.3854 0.97732 0.74938 14 0.70189 0.90036 0.64864 0.00615 0.00795 0.1469 15 0.56224 0.48462 0.45916 0.16076 0.27302 0.08922 16 0.82157 0.35318 0.4257 0.85515 0.53443 0.56506 17 0.80047 0.48567 0.36371 0.25489 0.14471 0.95966 18 0.6753 0.6737 0.5821 0.44261 0.36274 0.94253 19 0.83784 0.85743 0.66605 0.27026 0.32058 0.53512 20 0.8599 0.41089 0.37954 0.95858 0.83585 0.79425 21 0.70561 0.12291 0.21715 0.69932 0.0365 0.81971 22 0.20045 0.35562 0.80136 0.89809 0.74951 0.07787 23 0.89233 0.31063 0.50437 0.86666 0.52082 0.26937 24 0.74551 0.33981 0.67794 0.92183 0.22209 0.86333 25 0.38234 0.70897 0.84522 0.63723 0.48372 0.36959 26 0.48319 0.47456 0.90873 0.46162 0.65766 0.00159 27 0.83438 0.89913 0.57955 0.4483 0.58212 0.98116 28 0.49274 0.0159 0.93168 0.16264 0.22853 0.85393 29 0.19568 0.13576 0.29019 0.06538 0.21641 0.5337 30 0.6472 0.30968 0.07699 0.73935 0.20007 0.33851 31 0.12317 0.98203 0.75305 0.65892 0.461 0.17464 32 0.31406 0.07436 0.31047 0.53947 0.57473 0.5266 \end{filecontents} \documentclass{article} \usepackage{pgfplots} \usetikzlibrary{pgfplots.groupplots} \pgfplotsset{compat=1.9} \begin{document} \begin{tikzpicture} \begin{groupplot}[ group style={ group name=my plots, group size=1 by 6, xlabels at=edge bottom, xticklabels at=edge bottom, ylabels at=edge left, yticklabels at=edge left, vertical sep=0pt, }, ymin = 0.001, ymax = 10, ytick = {0.001,0.01,0.1,1}, ylabel={\phantom{$y$}}, xlabel={$x$}, width=\textwidth, height=0.2\textheight, ymode=log, ] \nextgroupplot \addplot table {\jobname Data.asc}; \coordinate (left top) at (rel axis cs:0,1); \nextgroupplot \addplot table [y index=2] {\jobname Data.asc}; \nextgroupplot \addplot table [y index=3] {\jobname Data.asc}; \nextgroupplot \addplot table [y index=4] {\jobname Data.asc}; \nextgroupplot \addplot table [y index=5] {\jobname Data.asc}; \nextgroupplot \addplot table [y index=6] {\jobname Data.asc}; \coordinate (left bot) at (rel axis cs:0,0); \end{groupplot} \path (left top) -- node[left=1.3cm,rotate=90] {$y$} (left bot); \end{tikzpicture} \end{document} Danke schön, das ist ja ne coole Methode, den befehl phantom hab ich noch nie gesehen. Wieder was gelernt. :-)
(17 Jul '14, 16:15)
lorbj
Warum muss man den Platz mit
(17 Jul '14, 16:47)
esdd
@esdd Ich wollte damit nur erreichen, dass der Plot dieselben Abmessungen hat, wie wenn die Beschriftung für jeden Plot eingeschaltet wäre. Man kann's natürlich auch weglassen.
(18 Jul '14, 01:14)
Henri
|
|
Während Henri in seiner Lösung geschickt Koordinaten als Bezugspunkt setzt, kann man sich auch auf die Bildabmessungen des entstandenen Plots beziehen. Direkt nach Ende des group-Plots: \path (current bounding box.north west) -- node[yshift=3ex,xshift=-2ex,rotate=90] {$y$} (current bounding box.south west); Etwas Shift noch, damit es perfekt an die Mitte des eigentlichen Plots rückt und in Abstand zur Achse (wenn man kein phantom-y setzt). Dann natürlich das Sehr schön, und danke! Die zweite Variante hat den vorzug, dass man bei längeren Beschriftungen trotzdem mittig bleibt. BTW: Warum der yshift?
(17 Jul '14, 16:00)
lorbj
@lorbj ich habe Deine Antwort in einen Kommentar umgewandelt. Antworten hier sind immer Lösungen der oben gestellten Frage. (Funktioniert hier anders als in einem Forum, hat aber den Vorteil, einen sehr übersichtlichen Archivcharakter zu bekommen...)
(17 Jul '14, 16:07)
cgnieder
@lorbj Dann steht das y schön an einer Linie. Sonst wird sich auf die Mitte der Gesamtzeichnung bezogen, einschließlich der Höhe der x-label-Beschriftung. Das wäre die genaue Mitte, doch mittig nur zum Plot ist schöner.
(17 Jul '14, 16:08)
stefan ♦♦
Aha, danke!
(17 Jul '14, 16:14)
lorbj
Noch ne ganz kurze Frage. Wie mach ich aus dem Punktlinien ein Liniendiagramm?
(17 Jul '14, 16:24)
lorbj
@Iorbj Das geht mit der Option
(17 Jul '14, 16:48)
esdd
Ergebnis 5 von 6
show 1 more comments
|

Herzlich willkommen auf der TeXwelt!
Danke! :-)