
|
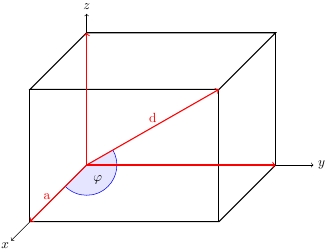
Ausgehend vom Beispiel \documentclass{standalone} \usepackage[utf8]{inputenc} \usepackage{tikz} \usetikzlibrary{angles,calc} \begin{document} \begin{tikzpicture}[x={(-0.5cm,-0.5cm)},y={(1cm,0cm)},z={(0cm,1cm)},scale=2] \coordinate (O) at (0,0,0); \coordinate (Ax) at (1.5,0,0); \coordinate (Ay) at (0,2.5,0); \coordinate (Az) at (0,0,1.75); \coordinate (Axy) at ($(Ax)+(Ay)$); \coordinate (Ayz) at ($(Ay)+(Az)$); \coordinate (Axz) at ($(Ax)+(Az)$); \coordinate (A) at ($(Ax)+(Ay)+(Az)$); \draw[->] (0,0,0) -- (2,0,0) node[below left=-2pt] {$x$}; \draw[->] (0,0,0) -- (0,3,0) node[right] {$y$}; \draw[->] (0,0,0) -- (0,0,2) node[above] {$z$}; \draw[thick] (Ax) -- (Axy) -- (Ay); \draw[thick] (Az) -- (Axz) -- (A) -- (Ayz) -- cycle; \draw[thick] (O) -- (Az); \draw[thick] (Ax) -- (Axz); \draw[thick] (Axy) -- (A); \draw[thick] (Ay) -- (Ayz); \pic [pic text=$\varphi$, pic text options={text=black},text opacity=1,draw,angle radius=8mm,blue,fill, fill opacity=0.1]{angle=Ax--O--A}; \draw[red,thick,->] (O) -- (Ax) node[pos=0.7,above] {a}; \draw[red,thick,->] (O) -- (Ay); \draw[red,thick,->] (O) -- (Az); \draw[red,thick,->] (O) -- (A) node[above,pos=0.5] {d}; \end{tikzpicture} \end{document}
würde ich gerne den Winkel phi zwischen Kante a und Raumdiagonale d so neigen (bzw. den Winkelbogen nicht als Kreis zeichnen), damit der Winkel "räumlicher" wirkt, als wenn er auf der Ebene ad liegen würde. Ich kann es leider schwer zeichnen, was ich meine: In etwa so, nur dass der Winkel später nicht so groß dargestellt sein soll.
Ist dies mit der |
|
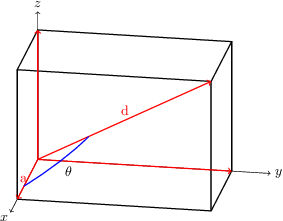
Hier eine Variante mit \documentclass{standalone} \usepackage{tikz,tikz-3dplot} \begin{document} \tdplotsetmaincoords{70}{100} \begin{tikzpicture}[scale=2,tdplot_main_coords] \tdplotdefinepoints(0,0,0)(1.5,0,0)(1.5,2.5,1.75) \coordinate (O) at (\tdplotvertexx,\tdplotvertexy,\tdplotvertexz); \coordinate (Ax) at (\tdplotbx,0,0); \coordinate (Ay) at (0,\tdplotby,0); \coordinate (Az) at (0,0,\tdplotbz); \coordinate (Axy) at (\tdplotbx,\tdplotby,0); \coordinate (Ayz) at (0,\tdplotby,\tdplotbz); \coordinate (Axz) at (\tdplotbx,0,\tdplotbz); \coordinate (A) at (\tdplotbx,\tdplotby,\tdplotbz); \draw[->] (0,0,0) -- (2,0,0) node[below left=-2pt] {$x$}; \draw[->] (0,0,0) -- (0,3,0) node[right] {$y$}; \draw[->] (0,0,0) -- (0,0,2) node[above] {$z$}; \draw[thick] (Ax) -- (Axy) -- (Ay); \draw[thick] (Az) -- (Axz) -- (A) -- (Ayz) -- cycle; \draw[thick] (O) -- (Az); \draw[thick] (Ax) -- (Axz); \draw[thick] (Axy) -- (A); \draw[thick] (Ay) -- (Ayz); \draw[red,thick,->] (O) -- (Ax) node[pos=0.7,above] {a}; \draw[red,thick,->] (O) -- (Ay); \draw[red,thick,->] (O) -- (Az); \draw[red,thick,->] (O) -- (A) node[above,pos=0.5] {d}; \tdplotdrawpolytopearc[blue,thick]{1}{anchor=north west}{$\theta$} \end{tikzpicture} \end{document}
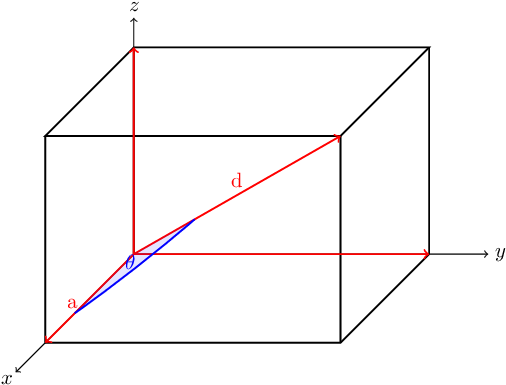
EDIT: Man kann die Definition von \documentclass{standalone} \usepackage{tikz,tikz-3dplot} \renewcommand\tdplotdrawpolytopearc[4][]{% %determine vector lengths \pgfmathsetmacro{\ax}{\tdplotax - \tdplotvertexx} \pgfmathsetmacro{\ay}{\tdplotay - \tdplotvertexy} \pgfmathsetmacro{\az}{\tdplotaz - \tdplotvertexz} \pgfmathsetmacro{\bx}{\tdplotbx - \tdplotvertexx} \pgfmathsetmacro{\by}{\tdplotby - \tdplotvertexy} \pgfmathsetmacro{\bz}{\tdplotbz - \tdplotvertexz} %determine normal to vectors \tdplotcrossprod(\ax,\ay,\az)(\bx,\by,\bz) %DEBUG: show the cross product %\draw[->,blue] (\tdplotvertexx,\tdplotvertexy,\tdplotvertexz) -- ++(\tdplotresx,\tdplotresy,\tdplotresz); %get angles for this vector \tdplotgetpolarcoords{\tdplotresx}{\tdplotresy}{\tdplotresz} \typeout{angles for cross product: phi: \tdplotresphi theta: \tdplotrestheta} %place the rotated coordinate system so that the z' axis points along this vector \tdplotsetrotatedcoords{\tdplotresphi}{\tdplotrestheta}{0} \coordinate (Vertex) at (\tdplotvertexx,\tdplotvertexy,\tdplotvertexz); \tdplotsetrotatedcoordsorigin{(Vertex)} %calculate the start angle of the arc \tdplottransformmainrot{\ax}{\ay}{\az} \tdplotgetpolarcoords{\tdplotresx}{\tdplotresy}{\tdplotresz} \pgfmathsetmacro{\tdplotstartphi}{\tdplotresphi} %calculate the end angle of the arc \tdplottransformmainrot{\bx}{\by}{\bz} \tdplotgetpolarcoords{\tdplotresx}{\tdplotresy}{\tdplotresz} %draw the arc \pgfmathparse{\tdplotstartphi < \tdplotresphi} \ifthenelse{\equal{\pgfmathresult}{1}}% {}% { \pgfmathsetmacro{\tdplotstartphi}{\tdplotstartphi - 360} } \draw[tdplot_rotated_coords,#1] (0,0,0) + (\tdplotstartphi:#2) arc (\tdplotstartphi:\tdplotresphi:#2); \fill[tdplot_rotated_coords,#1] (0,0,0) + (\tdplotstartphi:#2) arc (\tdplotstartphi:\tdplotresphi:#2) -- (0,0,0) -- (\tdplotstartphi:#2); \pgfmathsetmacro{\tdplotresphi}{(\tdplotresphi + \tdplotstartphi)/2} \draw[tdplot_rotated_coords] (0,0,0) + (\tdplotresphi:#2) node[#3]{#4}; } \newcommand\tdplotsetmycoords{% \pgfmathsetmacro{\raarot}{-.5}% \pgfmathsetmacro{\rbarot}{-.5}% % \pgfmathsetmacro{\rabrot}{1}% \pgfmathsetmacro{\rbbrot}{0}% % \pgfmathsetmacro{\racrot}{0}% \pgfmathsetmacro{\rbcrot}{1}% % \tikzset{tdplot_main_coords/.style={x={(\raarot cm,\rbarot cm)},y={(\rabrot cm, \rbbrot cm)},z={(\racrot cm, \rbcrot cm)}}}% } \begin{document} \tdplotsetmycoords \begin{tikzpicture}[scale=2,tdplot_main_coords] \tdplotdefinepoints(0,0,0)(1.5,0,0)(1.5,2.5,1.75) \coordinate (O) at (\tdplotvertexx,\tdplotvertexy,\tdplotvertexz); \coordinate (Ax) at (\tdplotbx,0,0); \coordinate (Ay) at (0,\tdplotby,0); \coordinate (Az) at (0,0,\tdplotbz); \coordinate (Axy) at (\tdplotbx,\tdplotby,0); \coordinate (Ayz) at (0,\tdplotby,\tdplotbz); \coordinate (Axz) at (\tdplotbx,0,\tdplotbz); \coordinate (A) at (\tdplotbx,\tdplotby,\tdplotbz); \draw[->] (0,0,0) -- (2,0,0) node[below left=-2pt] {$x$}; \draw[->] (0,0,0) -- (0,3,0) node[right] {$y$}; \draw[->] (0,0,0) -- (0,0,2) node[above] {$z$}; \draw[thick] (Ax) -- (Axy) -- (Ay); \draw[thick] (Az) -- (Axz) -- (A) -- (Ayz) -- cycle; \draw[thick] (O) -- (Az); \draw[thick] (Ax) -- (Axz); \draw[thick] (Axy) -- (A); \draw[thick] (Ay) -- (Ayz); \draw[red,thick,->] (O) -- (Ax) node[pos=0.7,above] {a}; \draw[red,thick,->] (O) -- (Ay); \draw[red,thick,->] (O) -- (Az); \draw[red,thick,->] (O) -- (A) node[above,pos=0.5] {d}; \tdplotdrawpolytopearc[blue,thick,fill opacity=0.1]{1}{above left=-4pt,blue}{$\theta$} \end{tikzpicture} \end{document}
@Henri Danke für den Vorschlag. Der Winkel sieht gut aus, das Koordinatensystem passt nicht so ganz zum Rest des Dokuments, da müsste ich dann wohl alles auf
(29 Sep '16, 11:05)
tom75
Macht
(01 Okt '16, 16:17)
cis
|
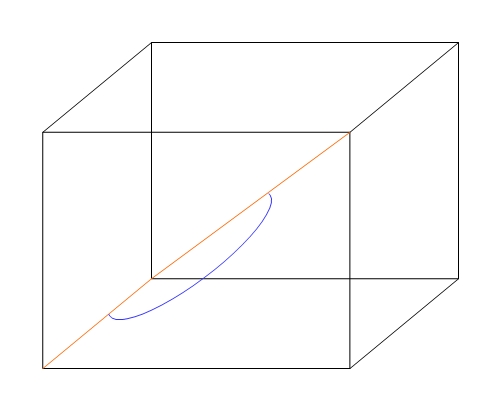
Ich bin ein grafischer DAU, habe aber Probleme mir vorzustellen, wie das geneigt aussehen soll. Ich würde stattdessen den Winkel nach (und damit über statt unter) den roten Linien und etwas stärker überdeckend, beispielsweise mit
\pic [pic text=$\varphi$, pic text options={text=black},text opacity=1,draw,angle radius=8mm,blue!25,fill, fill opacity=0.9]{angle=Ax--O--A};, zeichnen.@saputello Danke für den Tipp. Ich hab oben noch ein Bild eingefügt, um zu zeigen, was ich meine. (In Büchern wird das oft so dargestellt.)
Leider sind die ganzen Sachen wie
circleoderarcauf die x-y-Ebene beschränkt. Für echte 3D-Winkel musst dutikz-3dplotverwenden.