|
Ich möchte fraktale Landschaften generieren und die Möglichkeiten nutzen, die mit LaTeX und Co. verfügbar sind. Ansatz:
Ich werde ein komplettes Dokument als Antwort posten, das obiges umsetzt. Hat jemand dazu Verbesserungsvorschläge? Weitere Herausforderungen:
Wer experimentiert, z.B. nur den 3D Viewpoint ändert, kann den seed-Wert zum Initialisieren des Zufallsgenerators beibehalten, ansonsten variieren, bis etwas Schönes herauskommt. |
|
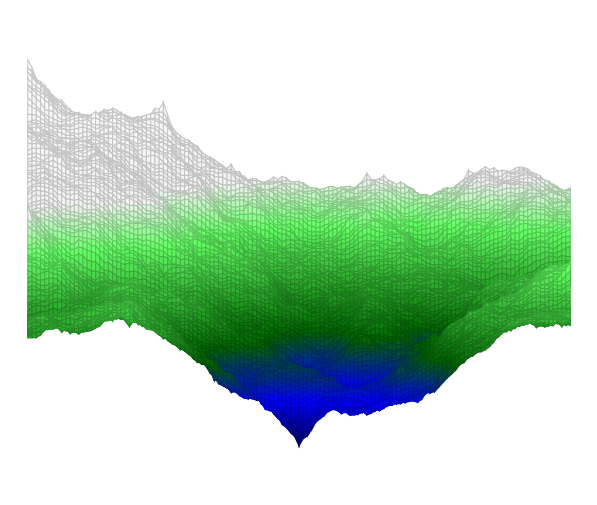
Diese Lösung verwendet den Diamond-square-Algorithmus in einer Implementierung von Marc Lepage. Den Lua-Code kann man natürlich auch auslagern, das ist sogar empfehlenswert. Hier belasse ich ihn der Handhabbarkeit halber im Dokument.
Zum Variieren den seed-Wert ändern, das ist der erste Parameter beim Aufruf der Terrain-Funktion. Festhalten, wenn man nur view ändern möchte. Die Berechnung dauert lange, zum Testen besser kleinere Werte für Matrix-Dimension und mesh rows (Dimension+1) wählen. \documentclass[border=10pt]{standalone} \usepackage{pgfplots} \usepackage{luacode} \begin{luacode*} function terrain(seed,dimension,options) -- inner functions come from the Heightmap module -- Module Copyright (C) 2011 Marc Lepage local max, random = math.max, math.random -- Find power of two sufficient for size local function pot(size) local pot = 2 while true do if size <= pot then return pot end pot = 2*pot end end -- Create a table with 0 to n zero values local function tcreate(n) local t = {} for i = 0, n do t[i] = 0 end return t end -- Square step -- Sets map[x][y] from square of radius d using height function f local function square(map, x, y, d, f) local sum, num = 0, 0 if 0 <= x-d then if 0 <= y-d then sum, num = sum + map[x-d][y-d], num + 1 end if y+d <= map.h then sum, num = sum + map[x-d][y+d], num + 1 end end if x+d <= map.w then if 0 <= y-d then sum, num = sum + map[x+d][y-d], num + 1 end if y+d <= map.h then sum, num = sum + map[x+d][y+d], num + 1 end end map[x][y] = f(map, x, y, d, sum/num) end -- Diamond step -- Sets map[x][y] from diamond of radius d using height function f local function diamond(map, x, y, d, f) local sum, num = 0, 0 if 0 <= x-d then sum, num = sum + map[x-d][y], num + 1 end if x+d <= map.w then sum, num = sum + map[x+d][y], num + 1 end if 0 <= y-d then sum, num = sum + map[x][y-d], num + 1 end if y+d <= map.h then sum, num = sum + map[x][y+d], num + 1 end map[x][y] = f(map, x, y, d, sum/num) end -- Diamond square algorithm generates cloud/plasma fractal heightmap -- http://en.wikipedia.org/wiki/Diamond-square_algorithm -- Size must be power of two -- Height function f must look like f(map, x, y, d, h) and return h' local function diamondsquare(size, f) -- create map local map = { w = size, h = size } for c = 0, size do map[c] = tcreate(size) end -- seed four corners local d = size map[0][0] = f(map, 0, 0, d, 0) map[0][d] = f(map, 0, d, d, 0) map[d][0] = f(map, d, 0, d, 0) map[d][d] = f(map, d, d, d, 0) d = d/2 -- perform square and diamond steps while 1 <= d do for x = d, map.w-1, 2*d do for y = d, map.h-1, 2*d do square(map, x, y, d, f) end end for x = d, map.w-1, 2*d do for y = 0, map.h, 2*d do diamond(map, x, y, d, f) end end for x = 0, map.w, 2*d do for y = d, map.h-1, 2*d do diamond(map, x, y, d, f) end end d = d/2 end return map end -- Default height function -- d is depth (from size to 1 by powers of two) -- h is mean height at map[x][y] (from square/diamond of radius d) -- returns h' which is used to set map[x][y] function defaultf(map, x, y, d, h) return h + (random()-0.5)*d end -- Create a heightmap using the specified height function (or default) -- map[x][y] where x from 0 to map.w and y from 0 to map.h function create(width, height, f) f = f and f or defaultf -- make heightmap local map = diamondsquare(pot(max(width, height)), f) -- clip heightmap to desired size for x = 0, map.w do for y = height+1, map.h do map[x][y] = nil end end for x = width+1, map.w do map[x] = nil end map.w, map.h = width, height return map end -- Initialize pseudo random number generator with seed, to be able to reproduce math.randomseed(seed) map = create(dimension, dimension) if options ~= [[]] then tex.sprint("\\addplot3[" .. options .. "] coordinates{") else tex.sprint("\\addplot3 coordinates{") end for x = 0, map.w do for y = 0, map.h do tex.sprint("("..x..","..y..","..map[x][y]..")") end end tex.sprint("};") end \end{luacode*} \begin{document} \begin{tikzpicture} \begin{axis}[colormap={terrain}{color(0cm)=(blue!40!black); color(1cm)=(blue); color(2cm)=(green!40!black); color(4cm)=(green!60!white);color(4cm)=(white!95!black); color(8cm)=(white); color(8cm)=(white)}, hide axis, view = {90}{10}] \directlua{terrain(14,128,[[surf,mesh/rows=129,mesh/check=false]])} \end{axis} \end{tikzpicture} \end{document}
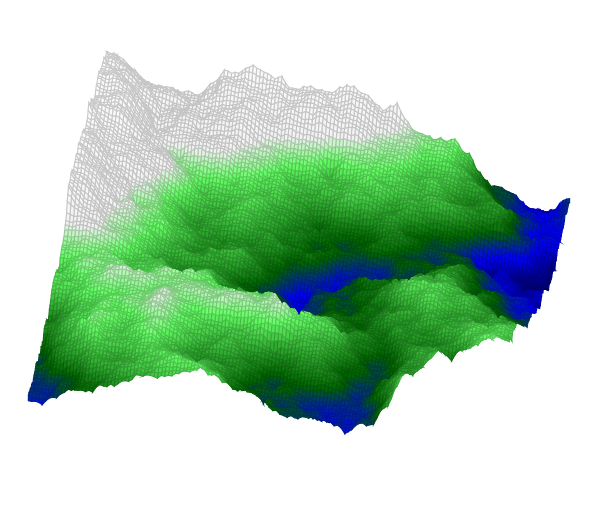
Mit
seed=10, view={10}{55}
Weitere Ideen und Schwierigkeiten stehen ganz oben am Ende der Frage. Verbesserungen und Idee sind sehr willkommen! 1
Die Farbeinstellungen (
(29 Jun '17, 06:34)
Pathe
@Pathe: Bitte auf keinen Fall Blockcode-Markdown in Kommentaren verwenden! Das zerstört leider noch immer die Kommentarfunktion und manchmal die ganze Seite!
(29 Jun '17, 12:48)
saputello
@Pathe: In LuaTeX 0.85 wurde
(29 Jun '17, 12:58)
saputello
@saputello Ich habe die Kommentar-Frage von @Pathe in eine separate Frage umgewandelt. Dass es schon eine ähnliche Frage gab, sah ich nicht. Es ist auch nicht ganz ein Duplikat, denn statt KOMA-Klasse ist es hier
(29 Jun '17, 13:18)
stefan ♦♦
|
|
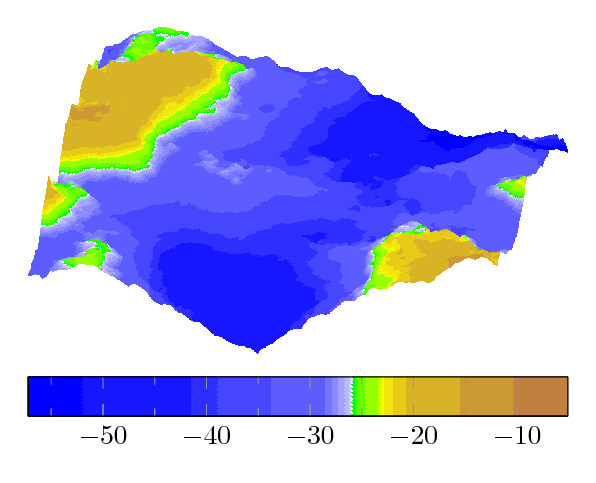
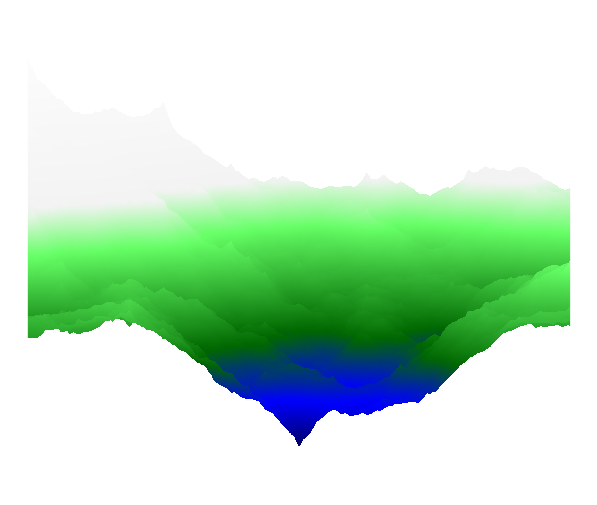
Dies hier ist ein Zusatz zu der exzellenten Antwort von Stefan: es verwendet neue Moeglichkeiten von colormaps, was bei Landschaften nicht uninteressant ist: \documentclass[border=10pt]{standalone} \usepackage{pgfplots} \pgfplotsset{compat=1.15} \usepackage{luacode} \begin{luacode*} function terrain(seed,dimension,options) -- inner functions come from the Heightmap module -- Module Copyright (C) 2011 Marc Lepage local max, random = math.max, math.random -- Find power of two sufficient for size local function pot(size) local pot = 2 while true do if size <= pot then return pot end pot = 2*pot end end -- Create a table with 0 to n zero values local function tcreate(n) local t = {} for i = 0, n do t[i] = 0 end return t end -- Square step -- Sets map[x][y] from square of radius d using height function f local function square(map, x, y, d, f) local sum, num = 0, 0 if 0 <= x-d then if 0 <= y-d then sum, num = sum + map[x-d][y-d], num + 1 end if y+d <= map.h then sum, num = sum + map[x-d][y+d], num + 1 end end if x+d <= map.w then if 0 <= y-d then sum, num = sum + map[x+d][y-d], num + 1 end if y+d <= map.h then sum, num = sum + map[x+d][y+d], num + 1 end end map[x][y] = f(map, x, y, d, sum/num) end -- Diamond step -- Sets map[x][y] from diamond of radius d using height function f local function diamond(map, x, y, d, f) local sum, num = 0, 0 if 0 <= x-d then sum, num = sum + map[x-d][y], num + 1 end if x+d <= map.w then sum, num = sum + map[x+d][y], num + 1 end if 0 <= y-d then sum, num = sum + map[x][y-d], num + 1 end if y+d <= map.h then sum, num = sum + map[x][y+d], num + 1 end map[x][y] = f(map, x, y, d, sum/num) end -- Diamond square algorithm generates cloud/plasma fractal heightmap -- http://en.wikipedia.org/wiki/Diamond-square_algorithm -- Size must be power of two -- Height function f must look like f(map, x, y, d, h) and return h' local function diamondsquare(size, f) -- create map local map = { w = size, h = size } for c = 0, size do map[c] = tcreate(size) end -- seed four corners local d = size map[0][0] = f(map, 0, 0, d, 0) map[0][d] = f(map, 0, d, d, 0) map[d][0] = f(map, d, 0, d, 0) map[d][d] = f(map, d, d, d, 0) d = d/2 -- perform square and diamond steps while 1 <= d do for x = d, map.w-1, 2*d do for y = d, map.h-1, 2*d do square(map, x, y, d, f) end end for x = d, map.w-1, 2*d do for y = 0, map.h, 2*d do diamond(map, x, y, d, f) end end for x = 0, map.w, 2*d do for y = d, map.h-1, 2*d do diamond(map, x, y, d, f) end end d = d/2 end return map end -- Default height function -- d is depth (from size to 1 by powers of two) -- h is mean height at map[x][y] (from square/diamond of radius d) -- returns h' which is used to set map[x][y] function defaultf(map, x, y, d, h) return h + (random()-0.5)*d end -- Create a heightmap using the specified height function (or default) -- map[x][y] where x from 0 to map.w and y from 0 to map.h function create(width, height, f) f = f and f or defaultf -- make heightmap local map = diamondsquare(pot(max(width, height)), f) -- clip heightmap to desired size for x = 0, map.w do for y = height+1, map.h do map[x][y] = nil end end for x = width+1, map.w do map[x] = nil end map.w, map.h = width, height return map end -- Initialize pseudo random number generator with seed, to be able to reproduce math.randomseed(seed) map = create(dimension, dimension) if options ~= [[]] then tex.sprint("\\addplot3[" .. options .. "] coordinates{") else tex.sprint("\\addplot3 coordinates{") end for x = 0, map.w do for y = 0, map.h do tex.sprint("("..x..","..y..","..map[x][y]..")") end end tex.sprint("};") end \end{luacode*} \begin{document} \begin{tikzpicture} \begin{axis}[ colormap={whiteblue}{color=(blue) color=(white)}, colormap={gb}{color=(green) color=(yellow) color=(brown)}, colormap={CM}{ of colormap={ whiteblue, target pos={-12000,-10000,-6000,-5000,-3000, -1000,-750,-500,-250,-100,-50,0}, sample for=const, }, of colormap={ gb, target pos={10,100, 200,500,1000,1100,1200,1500,2000,4000, 6000,8000}, sample for=const, }, }, % colorbar horizontal, colorbar style={minor x tick num=1, colormap access=const}, hide axis, view={10}{55}, ] \directlua{terrain(14,128,[[ surf,shader=interp, colormap access=const, mesh/rows=129,mesh/check=false]])} \end{axis} \end{tikzpicture} \end{document}
Die LUA implementierung ist 100% identisch; ich habe lediglich eine besondere colormap aus dem pgfplots manual (aus der Dokumentation des keys
|