|
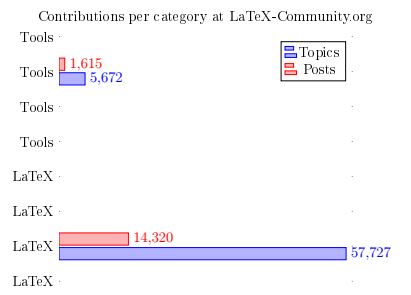
Hey, ich bin möchte ein Balkendiagramm mit Tikz erstellen und habe mich dabei an diesem Beispiel orientiert http://www.texample.net/tikz/examples/bar-chart. Jetzt möchte ich aber das nur zwei Kategorien da sind, also z.B. Latex & Tools. Meinen Code habe ich dementsprechend geändert: \begin{tikzpicture} \begin{axis}[title = Contributions per category at LaTeX-Community.org, xbar, y axis line style = { opacity = 0 }, axis x line = none, tickwidth = 0pt, enlarge y limits = 0.2, enlarge x limits = 0.02, symbolic y coords = {LaTeX, Tools}, nodes near coords, ] \addplot coordinates { (57727,LaTeX)(5672,Tools)}; \addplot coordinates { (14320,LaTeX)(1615,Tools)}; \legend{Topics, Posts} \end{axis} \end{tikzpicture} Problem ist jedoch, dass das ganze jetzt so aussieht
Könnt ihr mir sagen was ich falsch mache? Hab ich da irgendeinen Denkfehler? Ich bin Latex Anfänger. Danke euch!! |
|
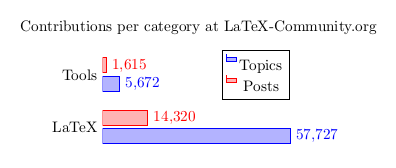
Du machst es schon richtig! Das Beispiel auf TeXample.net funktioniert, doch für weniger Markierungen auf der y-Achse müsste man es anpassen. Sonst hat man mehr als zwei y-Markierungen per Voreinstellung, jedoch nur zwei Beschriftungen. Damit wiederholen sie sich. Abhilfe schafft die Option Weiterhin kann es sinnvoll sein, den Plot mit \documentclass[border=10pt]{standalone} \usepackage{pgfplots} \begin{document} \begin{tikzpicture} \begin{axis}[title = Contributions per category at LaTeX-Community.org, xbar, y axis line style = { opacity = 0 }, axis x line = none, tickwidth = 0pt, enlarge y limits = 0.5, enlarge x limits = 0.02, ytick = data, height = 4cm, width = 6cm, symbolic y coords = {LaTeX, Tools}, nodes near coords, ] \addplot coordinates { (57727,LaTeX)(5672,Tools)}; \addplot coordinates { (14320,LaTeX)(1615,Tools)}; \legend{Topics, Posts} \end{axis} \end{tikzpicture} \end{document}
|