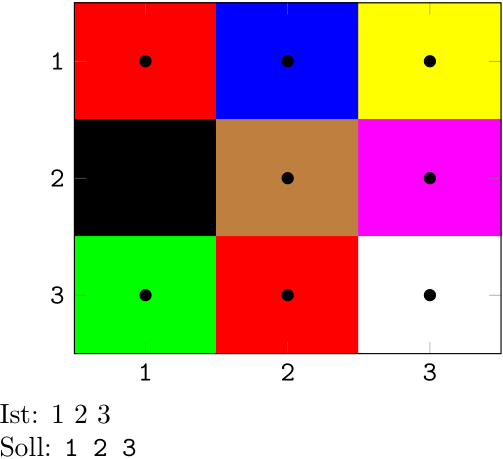
Mir ist aufgefallen, dass ticklabel style={font=\ttfamily} keine Wirkung hat. Was mache ich falsch?

Ich wollte die Schriftart der Zahlen auf den Achsen ändern.

alt text

Öffne in Overleaf
Code, hier editierbar zum Übersetzen:
%\documentclass[]{article}
\documentclass[border=3pt, varwidth]{standalone}
\usepackage{pgfplots}
\pgfplotsset{width=7cm,compat=1.13}
\begin{document}
\begin{tikzpicture}
\begin{axis}[enlargelimits=false,
ticklabel style={font=\ttfamily}, % Schriftart wird nicht angenommen?
]
\addplot[
matrix plot,
mark=*,%nodes near coords=\coordindex,
mesh/color input=explicit,
]
coordinates {
(1,1) [color=red] (2,1) [color=blue] (3,1) [color=yellow]
(1,2) [color=black] (2,2) [color=brown] (3,2) [color=magenta]
(1,3) [color=green] (2,3) [color=red] (3,3) [color=white]
};
\end{axis}
\end{tikzpicture}
\noindent Ist: 1 2 3 \\
Soll: \texttt{1 2 3 }
\end{document}
הההההההההההההההההההההההההההההההההההההההההההההההההההההההההההההההההההההההההההההההההההההההההההההההההההההההההההההההההההההההההההההההההההההההההההההההההההההההההההההההההההההההההההההההההההההההההההההההההההההההההההההההההההההההההההההההההההההההההההההההההההההההההההההההה
XXXXXXXXXXXXXXXXXXXXXXXXXXXXXXXXXXXXXXXXXXXXXXXXXXXXXXXXXXXXXXXXXXXXXXXXXXXXXXXXXXXXXXXXXXXXXXXXXXXXXXXXXXXXXXXXXXXXXXXXXXXXXXXXXXXXXXXXXXXXXXXXXXXXXXXXXXXXXXXXXXXXXXXXXXXXXXXXXXXXXXXXXXXXXXXXXXXXXXXXXXXXXXXXXXXXXXXXXXXXXXXXXXXXXXXXXXXXXXXXXXXXXXXXXXXXXXXX

gefragt 15 Jan '18, 19:42

cis's gravatar image

cis
9.6k104462491
Akzeptiert-Rate: 29%

bearbeitet 15 Jan '18, 22:19


\ttfamily etc. funktioniert nur für Textschriftarten, die Ticklabels werden aber im Mathemodus gesetzt (genauer genommen mit \pgfmathprintnumber). Dieses verhalten kann man in xticklabel überschreiben.

Öffne in Overleaf
Code, hier editierbar zum Übersetzen:
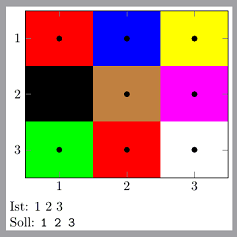
\documentclass{article}
\usepackage{pgfplots}
\pgfplotsset{width=7cm,compat=1.13}
\begin{document}
\begin{tikzpicture}
\begin{axis}[enlargelimits=false,
xticklabel={$\mathtt{\pgfmathprintnumber{\tick}}$},
yticklabel={$\mathtt{\pgfmathprintnumber{\tick}}$},
]
\addplot[
matrix plot,
mark=*,%nodes near coords=\coordindex,
mesh/color input=explicit,
]
coordinates {
(1,1) [color=red] (2,1) [color=blue] (3,1) [color=yellow]
(1,2) [color=black] (2,2) [color=brown] (3,2) [color=magenta]
(1,3) [color=green] (2,3) [color=red] (3,3) [color=white]
};
\end{axis}
\end{tikzpicture}
\noindent Ist: 1 2 3 \\
Soll: \texttt{1 2 3 }
\end{document}
הההההההההההההההההההההההההההההההההההההההההההההההההההההההההההההההההההההההההההההההההההההההההההההההההההההההההההההההההההההההההההההההההההההההההההההההההההההההההההההההההההההההההההההההההההההההההההההההההההההההההההההההההההההההההההההההההההההההההההההההההההההההההההההההה
XXXXXXXXXXXXXXXXXXXXXXXXXXXXXXXXXXXXXXXXXXXXXXXXXXXXXXXXXXXXXXXXXXXXXXXXXXXXXXXXXXXXXXXXXXXXXXXXXXXXXXXXXXXXXXXXXXXXXXXXXXXXXXXXXXXXXXXXXXXXXXXXXXXXXXXXXXXXXXXXXXXXXXXXXXXXXXXXXXXXXXXXXXXXXXXXXXXXXXXXXXXXXXXXXXXXXXXXXXXXXXXXXXXXXXXXXXXXXXXXXXXXXXXXXXXXXXXX

alt text

Permanenter link

beantwortet 16 Jan '18, 01:00

Henri's gravatar image

Henri
15.7k143943
Akzeptiert-Rate: 46%

Deine Antwort
[Vorschau ausblenden]

Folgen dieser Frage

Per E-Mail:

Wenn sie sich anmelden, kommen Sie für alle Updates hier in Frage

Per RSS:

Antworten

Antworten und Kommentare

Frage-Themen:

×298

gestellte Frage: 15 Jan '18, 19:42

Frage wurde gesehen: 6,224 Mal

zuletzt geändert: 16 Jan '18, 01:00