|
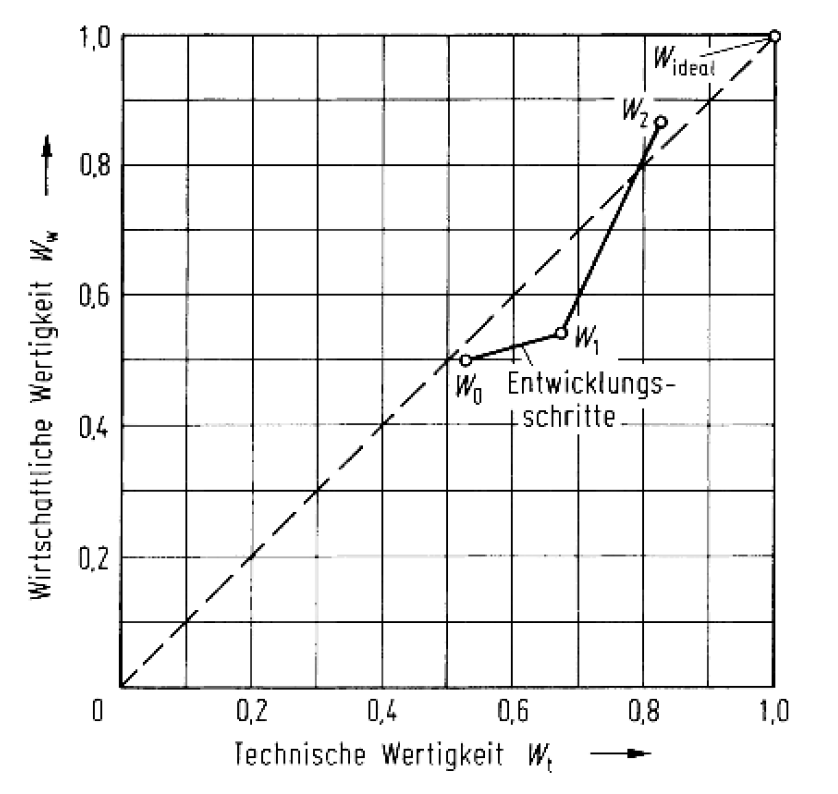
Hallo, ich würde gerne mit latex ein Stärke-Diagramm wie unten dargestellt
DIe Punkte W1, W2 usw errechne ich mir und würde die dann wie auf dem Bild eintragen
Hat einer eine Idee wie man so etwas realisieren kann? |
|
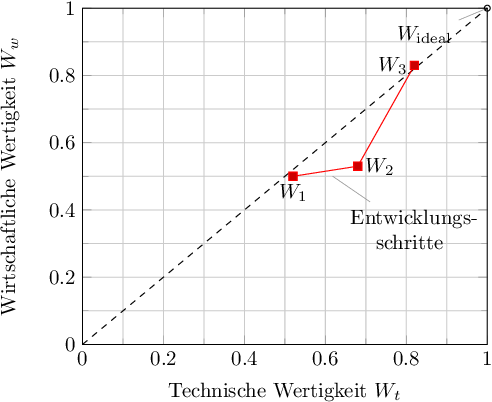
Ein Beispiel mit \documentclass[tikz]{standalone} \usepackage{pgfplots,amsmath} \begin{document} \begin{tikzpicture}[dot/.style={draw,circle,inner sep=1pt}] \begin{axis}[ clip=false, xlabel = {Technische Wertigkeit $W_t$}, ylabel = {Wirtschaftliche Wertigkeit $W_w$}, enlargelimits=false, minor tick num=1, grid = both, ] \addplot[dashed] coordinates { (0,0) (1,1) }; \addplot table[x index=0,y index=1] { 0.52 0.50 0.68 0.53 0.82 0.83 }; \node[dot,pin={200:$W_{\text{ideal}}$}] at (axis cs:1,1) {}; \node[below] at (axis cs:0.52,0.50) {$W_1$}; \node[right] at (axis cs:0.68,0.53) {$W_2$}; \node[left] at (axis cs:0.82,0.83) {$W_3$}; \path (axis cs:0.52,0.50) -- node[pin={[text width=2cm,align=center]-60:Entwicklungs\-schritte}] {} (axis cs:0.68,0.53); \end{axis} \end{tikzpicture} \end{document} |