|
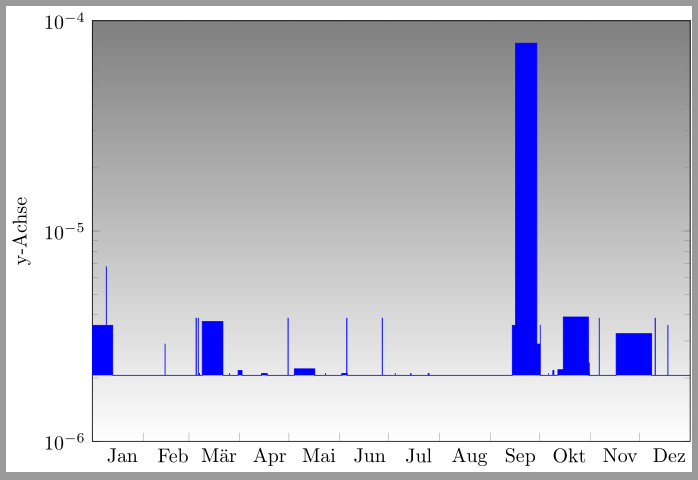
Wie erreiche ich, dass bei meiner x-Achse die Monatnamen auf deutsch statt auf englisch ausgegeben werden? \documentclass{standalone} \usepackage{tikz,pgfplots} \usepackage{pgfplotstable} \usepgfplotslibrary{dateplot} \begin{document} \begin{tikzpicture} \begin{semilogyaxis}[ axis background/.style = {shade,top color=gray,bottom color=white}, width = \textwidth, height = 9cm, enlargelimits=false, ymin=1E-6, ymax=1E-4, ylabel = {y-Achse}, date coordinates in = x, date ZERO = 2014-01-01 00, xmax = 2014-12-31 23:59, xtick = {2014-01-01, 2014-02-01, 2014-03-01, 2014-04-01, 2014-05-01, 2014-06-01, 2014-07-01, 2014-08-01, 2014-09-01, 2014-10-01, 2014-11-01, 2014-12-01}, xticklabel={\pgfcalendar{tickcal}{\tick}{\tick}{\pgfcalendarshorthand{m}{.}}}, xticklabel style = {anchor=north}, xticklabel style = {xshift=15pt} ] % Data \addplot+[const plot, color=blue, fill, blue, mark=] coordinates { (2014-01-01 00:00, 2.06E-06) (2014-01-01 00:00, 3.56E-06) (2014-01-09 11:53, 6.76E-06) (2014-01-09 13:21, 3.56E-06) (2014-01-13 09:26, 3.56E-06) (2014-01-13 09:55, 2.06E-06) (2014-02-14 09:05, 2.90E-06) (2014-02-14 09:56, 2.06E-06) (2014-03-05 07:32, 3.85E-06) (2014-03-05 11:04, 2.06E-06) (2014-03-06 15:22, 3.85E-06) (2014-03-06 16:52, 2.06E-06) (2014-03-07 08:06, 2.10E-06) (2014-03-07 11:34, 2.06E-06) (2014-03-09 01:50, 3.71E-06) (2014-03-21 17:15, 2.06E-06) (2014-03-25 15:46, 2.10E-06) (2014-03-25 16:43, 2.06E-06) (2014-03-31 00:00, 2.17E-06) (2014-04-02 09:00, 2.06E-06) (2014-04-07 00:00, 2.06E-06) (2014-04-09 09:00, 2.06E-06) (2014-04-14 06:57, 2.10E-06) (2014-04-15 15:06, 2.10E-06) (2014-04-16 14:36, 2.10E-06) (2014-04-17 17:50, 2.06E-06) (2014-04-30 10:50, 3.85E-06) (2014-04-30 13:12, 2.06E-06) (2014-05-04 06:35, 2.21E-06) (2014-05-16 19:45, 2.06E-06) (2014-05-23 08:35, 2.10E-06) (2014-05-23 08:45, 2.06E-06) (2014-06-02 07:09, 2.10E-06) (2014-06-05 08:13, 3.85E-06) (2014-06-05 11:20, 2.10E-06) (2014-06-05 14:50, 2.06E-06) (2014-06-26 23:30, 3.85E-06) (2014-06-27 01:30, 2.06E-06) (2014-07-04 23:02, 2.10E-06) (2014-07-04 23:12, 2.06E-06) (2014-07-14 07:07, 2.10E-06) (2014-07-14 13:46, 2.06E-06) (2014-07-25 00:55, 2.10E-06) (2014-07-25 02:16, 2.06E-06) (2014-07-25 07:58, 2.10E-06) (2014-07-25 12:00, 2.06E-06) (2014-07-25 12:28, 2.10E-06) (2014-07-25 14:10, 2.06E-06) (2014-08-11 09:00, 2.06E-06) (2014-09-12 11:40, 2.06E-06) (2014-09-14 09:39, 3.56E-06) (2014-09-16 08:52, 7.82E-05) (2014-09-29 09:30, 7.82E-05) (2014-09-29 09:39, 2.90E-06) (2014-10-01 08:52, 2.90E-06) (2014-10-01 10:56, 2.06E-06) (2014-10-01 11:07, 3.56E-06) (2014-10-01 11:46, 2.06E-06) (2014-10-06 10:44, 2.10E-06) (2014-10-06 10:50, 2.06E-06) (2014-10-09 04:36, 2.17E-06) (2014-10-09 19:33, 2.06E-06) (2014-10-12 06:42, 2.19E-06) (2014-10-15 12:54, 3.90E-06) (2014-10-30 12:54, 3.90E-06) (2014-10-30 20:40, 2.06E-06) (2014-10-30 20:54, 2.19E-06) (2014-10-31 07:31, 2.36E-06) (2014-10-31 09:57, 2.10E-06) (2014-10-31 13:38, 2.06E-06) (2014-11-06 11:18, 3.85E-06) (2014-11-06 12:23, 2.06E-06) (2014-11-13 08:30, 2.06E-06) (2014-11-13 14:48, 2.06E-06) (2014-11-16 19:34, 3.25E-06) (2014-12-08 12:30, 2.06E-06) (2014-12-10 15:04, 3.85E-06) (2014-12-10 17:45, 2.06E-06) (2014-12-18 09:35, 3.56E-06) (2014-12-18 10:33, 2.06E-06) (2014-12-31 23:59, 2.06E-06) }; \end{semilogyaxis} \end{tikzpicture} \end{document} |
|
Die pgfplots Bibliothek Die zu ladenden Wörterbücher können als Paketoption angegeben werden. Für das deutsche kann man wie bei Bei der Ausgabe genutzt werden dann diejenigen, auf die Mit
|