|
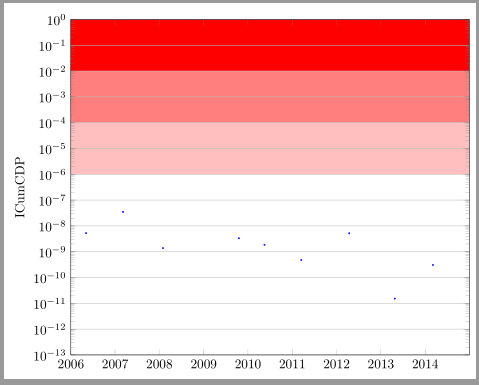
Ich möchte gerne nur die Jahreszahlen in der x-Achse ausgeben lassen. \documentclass{standalone} \usepackage{pgfplots} \usepackage{pgfplotstable} \pgfplotsset{compat=newest} \usepgfplotslibrary{dateplot} \usetikzlibrary{shapes,arrows, patterns} \begin{document} \begin{tikzpicture} \begin{semilogyaxis}[ width = \textwidth, axis on top = true, xmin = 2006-01-01, xmax = 2014-12-31, xtick = {2006-01-01, 2007-01-01, 2008-01-01, 2009-01-01, 2010-01-01, 2011-01-01, 2012-01-01, 2013-01-01, 2014-01-01}, xticklabel style ={/pgf/number format/1000 sep=}, ymin = 1.0e-13, ymax = 1, ylabel = {ICumCDP}, ymajorgrids, date coordinates in = x, date ZERO = 2006-01-01 ] \addplot[blue, only marks, mark size = 0.5] coordinates { (2006-05-07, 5.25e-09) (2007-03-08, 3.52e-08) (2008-01-31, 1.38e-09) (2009-10-18, 3.32e-09) (2010-05-17, 1.86e-09) (2011-03-17, 4.80e-10) (2012-04-15, 5.18e-09) (2013-04-26, 1.53e-11) (2014-03-06, 3.07e-10) }; \fill [red!25] (axis cs:2006-01-01,1E-6) rectangle (axis cs:2014-12-31,1E-4); \fill [red!50] (axis cs:2006-01-01,1E-4) rectangle (axis cs:2014-12-31,1E-2); \fill [red] (axis cs:2006-01-01,1E-2) rectangle (axis cs:2014-12-31,1); \end{semilogyaxis} \end{tikzpicture} \end{document} |
|
Setze die Option xticklabel=\year
nach der Option date coordinates in = x
Code: \documentclass[margin=5pt]{standalone} \usepackage{pgfplots} \usepgfplotslibrary{dateplot} \pgfplotsset{compat=newest} \begin{document} \begin{tikzpicture} \begin{semilogyaxis}[ width = \textwidth, axis on top = true, date coordinates in = x, date ZERO = 2006-01-01, xmin = 2006-01-01, xmax = 2014-12-31, xtick = {2006-01-01, 2007-01-01, 2008-01-01, 2009-01-01, 2010-01-01, 2011-01-01, 2012-01-01, 2013-01-01, 2014-01-01}, xticklabel=\year, ymin = 1.0e-13, ymax = 1, ylabel = {ICumCDP}, ymajorgrids, ] \addplot[blue, only marks, mark size = 0.5] coordinates { (2006-05-07, 5.25e-09) (2007-03-08, 3.52e-08) (2008-01-31, 1.38e-09) (2009-10-18, 3.32e-09) (2010-05-17, 1.86e-09) (2011-03-17, 4.80e-10) (2012-04-15, 5.18e-09) (2013-04-26, 1.53e-11) (2014-03-06, 3.07e-10) }; \fill [red!25] (axis cs:2006-01-01,1E-6) rectangle (axis cs:2014-12-31,1E-4); \fill [red!50] (axis cs:2006-01-01,1E-4) rectangle (axis cs:2014-12-31,1E-2); \fill [red] (axis cs:2006-01-01,1E-2) rectangle (axis cs:2014-12-31,1); \end{semilogyaxis} \end{tikzpicture} \end{document} Interessant, dass es hier offenkundig bei den Optionen auch auf die Reihenfolge ankommt. Merci für deine kompetente Hilfe!
(10 Jun '15, 15:58)
dzaic
|