|
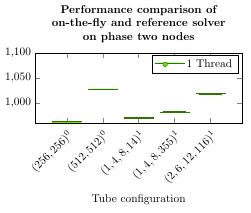
Ich brauche, dass die xticklabels mathematisch dargestellt werden, so dass die Zahlen nach den (...) im label als Hochzahlen dargestellt werden. \documentclass{minimal} \usepackage{tikz} \usetikzlibrary{positioning} \usepackage{pgfplots} % Use tikzpicture for the diagrams \usetikzlibrary{pgfplots.statistics} \usetikzlibrary{patterns} \usetikzlibrary{calc} \usetikzlibrary{spy} \pgfplotsset{compat=1.12} \usepackage{mathtools} \begin{document} \newlength\figureheight \newlength\figurewidth \setlength\figureheight{3.75cm} \setlength\figurewidth{8.0cm} % Preamble: \pgfplotsset{width=7cm,compat=1.14}\usepgfplotslibrary{statistics} \definecolor{RYB1}{RGB}{97,230,1} \definecolor{RYB2}{RGB}{200,150,250} \definecolor{RYB3}{RGB}{230,97,1} \pgfplotscreateplotcyclelist{colorbrewer-RYB1}{ {RYB1!50!black,fill=RYB1}, {RYB1!50!black,fill=RYB1}, {RYB1!50!black,fill=RYB1}} %Do not add a comma after the last element of the list! \begin{tikzpicture} %\begin{groupplot} \begin{axis} [ width=\figurewidth, height=\figureheight, xtick={1,2,3,4,5}, xticklabels={(256,256)0,(512,512)0,(1,4,8,14)1,(1,4,8,355)1,(2,6,12,116)1}, ymin = 960, ymax = 1100, xlabel={Tube configuration}, x tick label style={rotate=45,anchor=east}, boxplot/draw direction=y, cycle list name=colorbrewer-RYB1, title style={font=\bfseries, yshift=0ex}, align =center, title={Performance comparison of\\ on-the-fly and reference solver\\ on phase two nodes}, ] % 256 / 256 \addplot+[boxplot={draw position=1}] table[row sep=\\,y index=0] { data\\ 962.9202501\\ 963.1869383\\ }; \addlegendentry{1 Thread}; % 512 / 512 \addplot+[boxplot={draw position=2}] table[row sep=\\,y index=0] { data\\ 1028.056863\\ 1028.794504\\ 1028.877725\\ }; % 1 / 14 / 8 / 4 \addplot+[boxplot={draw position=3}] table[row sep=\\,y index=0] { data\\ 969.8845894\\ 971.1424572\\ 972.0283485\\ }; % 1 / 4 / 8 / 355 \addplot+[boxplot={draw position=4}] table[row sep=\\,y index=0] { data\\ 983.0304642\\ 981.4213649\\ 981.7510523\\ }; % 2 / 6 / 12 / 116 \addplot+[boxplot={draw position=5}] table[row sep=\\,y index=0] { data\\ 1018.936179\\ 1019.38764\\ 1019.95342\\ }; \end{axis} \end{tikzpicture}% Preamble: \pgfplotsset{width=7cm,compat=1.14}\usepgfplotslibrary{statistics} \end{document} |
|
Das sollte kein größeres Problem sein. Allerdings ragen die Labels dann unschön dicht an die Achse, weshalb ich die Platzierung von \documentclass{article}% minimal ist keine Klasse für Minimalbeispiele!!! \usepackage{pgfplots} % Use tikzpicture for the diagrams \pgfplotsset{compat=1.12}% Unbedingt unmittelbar nach dem Laden von pgfplots, % vor irgendwelchen weiteren pgfplots-Einstellungen % und vor dem Laden irgendwelcher Libs. % Siehe http://texwelt.de/wissen/fragen/19163 % \pgfplotsset{compat=1.14}% Wäre eine aktuelle Einstellung und bei Verwendung % eines aktuellen pgfplots zu bevorzugen! \usepgfplotslibrary{statistics}% pgf-Libraries besser so laden \begin{document} \newlength\figureheight \newlength\figurewidth \setlength\figureheight{3.75cm} \setlength\figurewidth{8.0cm} \definecolor{RYB1}{RGB}{97,230,1} \definecolor{RYB2}{RGB}{200,150,250} \definecolor{RYB3}{RGB}{230,97,1} \pgfplotscreateplotcyclelist{colorbrewer-RYB1}{ {RYB1!50!black,fill=RYB1}, {RYB1!50!black,fill=RYB1}, {RYB1!50!black,fill=RYB1}%Do not add a comma after the last element of the %list! } \begin{tikzpicture} \begin{axis} [ width=\figurewidth, height=\figureheight, xtick={1,2,3,4,5}, xticklabels={{$(256,256)^0$},{$(512,512)^0$},{$(1,4,8,14)^1$},{$(1,4,8,355)^1$},{$(2,6,12,116)^1$}}, ymin = 960, ymax = 1100, xlabel={Tube configuration}, x tick label style={rotate=45,anchor=north east}, boxplot/draw direction=y, cycle list name=colorbrewer-RYB1, title style={font=\bfseries, yshift=0ex}, align =center, title={Performance comparison of\\ on-the-fly and reference solver\\ on phase two nodes}, ] % 256 / 256 \addplot+[boxplot={draw position=1}] table[row sep=\\,y index=0] { data\\ 962.9202501\\ 963.1869383\\ }; \addlegendentry{1 Thread}; % 512 / 512 \addplot+[boxplot={draw position=2}] table[row sep=\\,y index=0] { data\\ 1028.056863\\ 1028.794504\\ 1028.877725\\ }; % 1 / 14 / 8 / 4 \addplot+[boxplot={draw position=3}] table[row sep=\\,y index=0] { data\\ 969.8845894\\ 971.1424572\\ 972.0283485\\ }; % 1 / 4 / 8 / 355 \addplot+[boxplot={draw position=4}] table[row sep=\\,y index=0] { data\\ 983.0304642\\ 981.4213649\\ 981.7510523\\ }; % 2 / 6 / 12 / 116 \addplot+[boxplot={draw position=5}] table[row sep=\\,y index=0] { data\\ 1018.936179\\ 1019.38764\\ 1019.95342\\ }; \end{axis} \end{tikzpicture} \end{document}
Für das Beispiel überflüssige Pakete und Libraries habe ich weggelassen. Super vielen Dank. Compat habe ich auch geändert, sowohl Version als Position. Die {} innerhalb der ticklabels waren der Kniff, der mir gefehlt hat.
(07 Mär '17, 09:21)
TuxedoMask2002
|