|
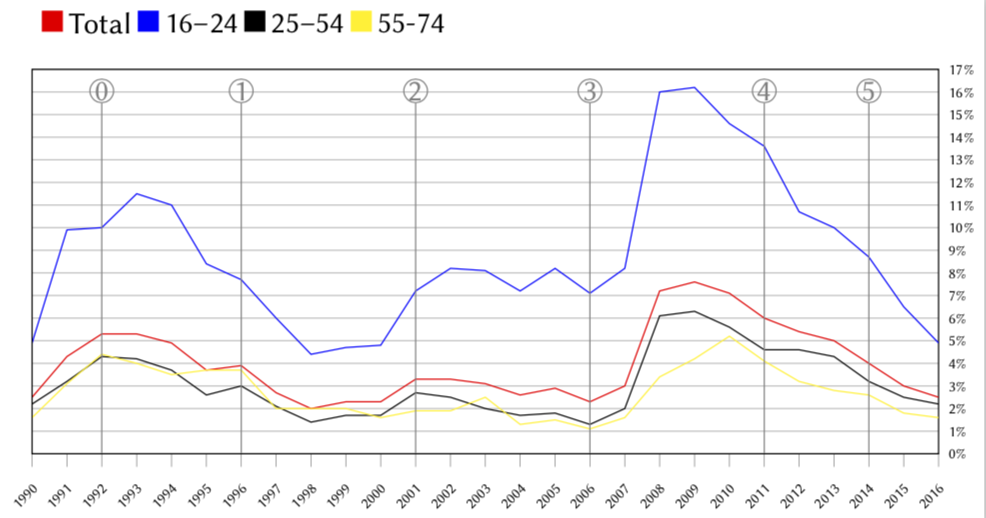
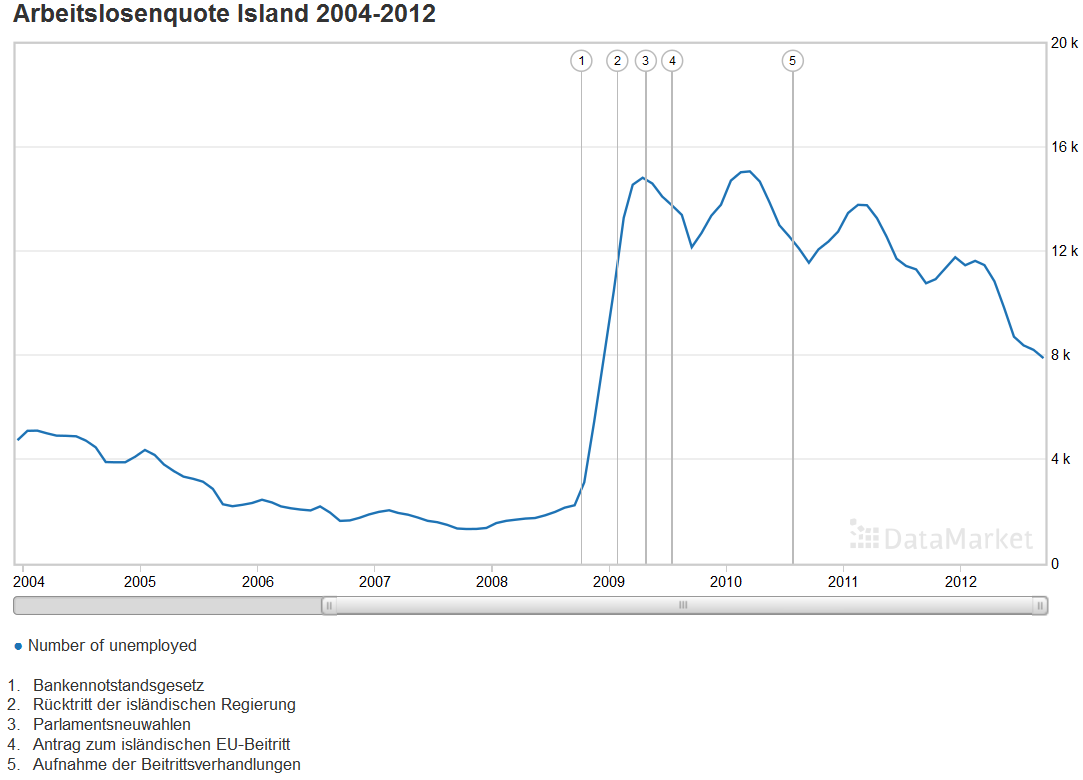
Ich hab nachfolgende Statistik erzeugt. Ich würde nun gerne bestimmte Ereignisse hervorheben und unter/neben dem Bild als Erläuterung angeben. Ungefähr wie in:
Gegebenenfalls auch direkt, ohne Legendeneintrag, in die Statistik reinpacken, aber bei längeren Beschriftungen wird das wohl nicht passen. \begin{filecontents*}{GDP.csv} Jahr,Total,Jung,Mittel,Alt 1990-01-01,2.5,4.9,2.2,1.6 1991-01-01,4.3,9.9,3.2,3.1 1992-01-01,5.3,10.0,4.3,4.4 1993-01-01,5.3,11.5,4.2,4.0 1994-01-01,4.9,11.0,3.7,3.5 1995-01-01,3.7,8.4,2.6,3.7 1996-01-01,3.9,7.7,3.0,3.7 1997-01-01,2.7,6.0,2.1,2.0 1998-01-01,2.0,4.4,1.4,2.0 1999-01-01,2.3,4.7,1.7,2.0 2000-01-01,2.3,4.8,1.7,1.6 2001-01-01,3.3,7.2,2.7,1.9 2002-01-01,3.3,8.2,2.5,1.9 2003-01-01,3.1,8.1,2.0,2.5 2004-01-01,2.6,7.2,1.7,1.3 2005-01-01,2.9,8.2,1.8,1.5 2006-01-01,2.3,7.1,1.3,1.1 2007-01-01,3.0,8.2,2.0,1.6 2008-01-01,7.2,16.0,6.1,3.4 2009-01-01,7.6,16.2,6.3,4.2 2010-01-01,7.1,14.6,5.6,5.2 2011-01-01,6.0,13.6,4.6,4.1 2012-01-01,5.4,10.7,4.6,3.2 2013-01-01,5.0,10.0,4.3,2.8 2014-01-01,4.0,8.7,3.2,2.6 2015-01-01,3.0,6.5,2.5,1.8 2016-01-01,2.5,4.9,2.2,1.6 \end{filecontents*} \documentclass[tikz]{standalone} \usepackage{pgfplots} \usepgfplotslibrary{dateplot} \usepackage[main=ngerman,icelandic,danish,frenchb]{babel} \usepackage[T1]{fontenc} \usepackage[utf8]{inputenc} \usepackage[oldstyle,sflining]{libertine} \begin{document} \sffamily \begin{tikzpicture} % \sffamily \begin{axis}[ date ZERO=1990-01-01, date coordinates in=x, no marks, width=12cm, height=6cm, enlargelimits=false, xticklabel={\tiny\year}, xticklabel style={rotate=45,anchor=north east}, xtick={1990-01-01,1991-01-01,1992-01-01,1993-01-01,1994-01-01,1995-01-01,1996-01-01,1997-01-01,1998-01-01,1999-01-01,2000-01-01,2001-01-01,2002-01-01,2003-01-01,2004-01-01,2005-01-01,2006-01-01,2007-01-01,2008-01-01,2009-01-01,2010-01-01,2011-01-01,2012-01-01,2013-01-01,2014-01-01,2015-01-01,2016-01-01}, xtick pos=left, xtick align=outside, cycle multi list={mark list\nextlist color list}, ymin=-0,ymax=17, ytick={0,1,2,3,4,...,17}, yticklabel={\tiny\pgfmathprintnumber[verbatim]{\tick}\%}, ytick style={draw=none}, yticklabel pos=right, ymajorgrids=true, legend style={ draw=none, legend cell align=left, at={(0,1.05)},% <- anchor=south west,% <- legend image code/.code={ \filldraw[##1] (-.5ex,-.5ex) rectangle (1ex,1ex); }, }, legend columns=-1% <- ] \addplot table[col sep=comma,x=Jahr,y={Total}] {GDP.csv}; \addlegendentry{Total}; \addplot table[col sep=comma,x=Jahr,y={Jung}] {GDP.csv}; \addlegendentry{16--24}; \addplot table[col sep=comma,x=Jahr,y={Mittel}] {GDP.csv}; \addlegendentry{25--54}; \addplot table[col sep=comma,x=Jahr,y={Alt}] {GDP.csv}; \addlegendentry{55-74}; \end{axis} \end{tikzpicture} \end{document} |
|
Man kann einfach einen \begin{filecontents*}{GDP.csv} Jahr,Total,Jung,Mittel,Alt 1990-01-01,2.5,4.9,2.2,1.6 1991-01-01,4.3,9.9,3.2,3.1 1992-01-01,5.3,10.0,4.3,4.4 1993-01-01,5.3,11.5,4.2,4.0 1994-01-01,4.9,11.0,3.7,3.5 1995-01-01,3.7,8.4,2.6,3.7 1996-01-01,3.9,7.7,3.0,3.7 1997-01-01,2.7,6.0,2.1,2.0 1998-01-01,2.0,4.4,1.4,2.0 1999-01-01,2.3,4.7,1.7,2.0 2000-01-01,2.3,4.8,1.7,1.6 2001-01-01,3.3,7.2,2.7,1.9 2002-01-01,3.3,8.2,2.5,1.9 2003-01-01,3.1,8.1,2.0,2.5 2004-01-01,2.6,7.2,1.7,1.3 2005-01-01,2.9,8.2,1.8,1.5 2006-01-01,2.3,7.1,1.3,1.1 2007-01-01,3.0,8.2,2.0,1.6 2008-01-01,7.2,16.0,6.1,3.4 2009-01-01,7.6,16.2,6.3,4.2 2010-01-01,7.1,14.6,5.6,5.2 2011-01-01,6.0,13.6,4.6,4.1 2012-01-01,5.4,10.7,4.6,3.2 2013-01-01,5.0,10.0,4.3,2.8 2014-01-01,4.0,8.7,3.2,2.6 2015-01-01,3.0,6.5,2.5,1.8 2016-01-01,2.5,4.9,2.2,1.6 \end{filecontents*} \begin{filecontents*}{SPECIAL.csv} Jahr,Event 1992-01-01,1 1996-01-01,2 2001-01-01,3 2006-01-01,4 2011-01-01,5 2014-01-01,6 \end{filecontents*} \documentclass[tikz]{standalone} \usepackage{pgfplots} \pgfplotsset{compat=1.15} \usetikzlibrary{plotmarks} \usepgfplotslibrary{dateplot} \usepackage[main=ngerman,icelandic,danish,frenchb]{babel} \usepackage[T1]{fontenc} \usepackage[utf8]{inputenc} \usepackage[oldstyle,sflining]{libertine} \begin{document} \sffamily \begin{tikzpicture} % \sffamily \begin{axis}[ date ZERO=1990-01-01, date coordinates in=x, width=12cm, height=6cm, no marks, enlargelimits=false, xticklabel={\tiny\year}, xticklabel style={rotate=45,anchor=north east}, xtick={1990-01-01,1991-01-01,1992-01-01,1993-01-01,1994-01-01,1995-01-01,1996-01-01,1997-01-01,1998-01-01,1999-01-01,2000-01-01,2001-01-01,2002-01-01,2003-01-01,2004-01-01,2005-01-01,2006-01-01,2007-01-01,2008-01-01,2009-01-01,2010-01-01,2011-01-01,2012-01-01,2013-01-01,2014-01-01,2015-01-01,2016-01-01}, xtick pos=left, xtick align=outside, cycle multi list={mark list\nextlist color list}, ymin=-0,ymax=17, ytick={0,1,2,3,4,...,17}, yticklabel={\tiny\pgfmathprintnumber[verbatim]{\tick}\%}, ytick style={draw=none}, yticklabel pos=right, ymajorgrids=true, legend style={ draw=none, legend cell align=left, at={(0,1.05)},% <- anchor=south west,% <- legend image code/.code={ \filldraw[##1] (-.5ex,-.5ex) rectangle (1ex,1ex); }, }, legend columns=-1% <- ] \addplot table[col sep=comma,x=Jahr,y={Total}] {GDP.csv}; \addlegendentry{Total}; \addplot table[col sep=comma,x=Jahr,y={Jung}] {GDP.csv}; \addlegendentry{16--24}; \addplot table[col sep=comma,x=Jahr,y={Mittel}] {GDP.csv}; \addlegendentry{25--54}; \addplot table[col sep=comma,x=Jahr,y={Alt}] {GDP.csv}; \addlegendentry{55-74}; \addplot+[gray,ycomb, nodes near coords={\coordindex}, nodes near coords style={circle,draw,inner sep=0pt,font=\sffamily}] table[col sep=comma,x=Jahr,y expr={15.5}] {SPECIAL.csv}; \end{axis} \end{tikzpicture} \end{document}
|