|
Wie kann ich eine Mit Öffne in Overleaf
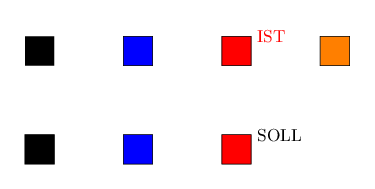
\documentclass[margin=5mm, tikz]{standalone} \usepackage{pgfplots} \usepgfplotslibrary{colormaps} \pgfplotsset{compat=1.12} \tikzset{Farbe/.style={/utils/exec={\pgfplotscolormapdefinemappedcolor{#1}}, draw=black, fill=mapped color} } \begin{document} \begin{tikzpicture} \begin{axis}[ % Geht nicht %colormap={test}{color(0cm)=(red); color(1cm)=(blue); color(2cm)=(red);} % Alles schwarz colormap={test}{color=(black) color=(red)}, % %colormap/hsv, hide axis,axis equal, xmin=-2.5, xmax=5, ymin=-.5, ymax=.5, ] \draw[Farbe=0, xshift=-2cm] (0,0) rectangle (1,1); \draw[Farbe=1] (0,0) rectangle (1,1); \draw[Farbe=2, xshift=2cm] (0,0) rectangle (1,1) node[right]{IST}; \draw[fill=black, xshift=-2cm, yshift=-2cm] (0,0) rectangle (1,1); \draw[fill=blue, yshift=-2cm] (0,0) rectangle (1,1); \draw[fill=red, xshift=2cm, yshift=-2cm] (0,0) rectangle (1,1) node[right]{SOLL}; \end{axis} \end{tikzpicture} \end{document} |
|
Hab es rausgefunden. Es geht mit Öffne in Overleaf
% https://tex.stackexchange.com/questions/233600/construct-colormap-for-iso-level-surface-in-pgfplots
\pgfplotsset
{
    colormap={test}%
    {
        [1pt] % colormap steps: 1pt
        color(0pt)=(black);
        color(1pt)=(blue);
        color(2pt)=(red);
        color(3pt)=(orange);
    }
}
und dann Öffne in Overleaf
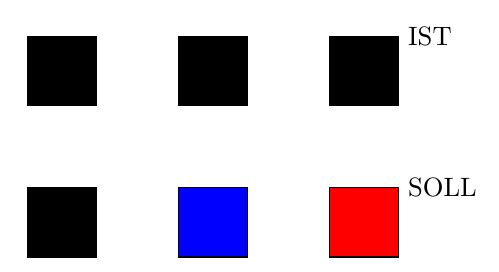
index of colormap={<0,1,2,3> of test} MWE:
Öffne in Overleaf
\documentclass[margin=5mm, tikz]{standalone} \usepackage{pgfplots} \usepgfplotslibrary{colormaps} \pgfplotsset{compat=1.12} \begin{document} % https://tex.stackexchange.com/questions/233600/construct-colormap-for-iso-level-surface-in-pgfplots \pgfplotsset { colormap={test}% { [1pt] % colormap steps: 1pt color(0pt)=(black); color(1pt)=(blue); color(2pt)=(red); color(3pt)=(orange); } } \tikzset{farbe/.style={ index of colormap={#1 of test}, fill, draw=black} } \begin{tikzpicture} \begin{axis}[ hide axis,axis equal, xmin=-3.5, xmax=8, ymin=-.5, ymax=.5, ] \fill[index of colormap={0 of test}, xshift=-2cm] (0,0) rectangle (1,1); \draw[farbe=1] (0,0) rectangle (1,1); \draw[farbe=2, xshift=2cm] (0,0) rectangle (1,1) node[right]{IST}; \draw[farbe=3, xshift=4cm] (0,0) rectangle (1,1); \draw[fill=black, xshift=-2cm, yshift=-2cm] (0,0) rectangle (1,1); \draw[fill=blue, yshift=-2cm] (0,0) rectangle (1,1); \draw[fill=red, xshift=2cm, yshift=-2cm] (0,0) rectangle (1,1) node[right]{SOLL}; \end{axis} \end{tikzpicture} \end{document} |