
|
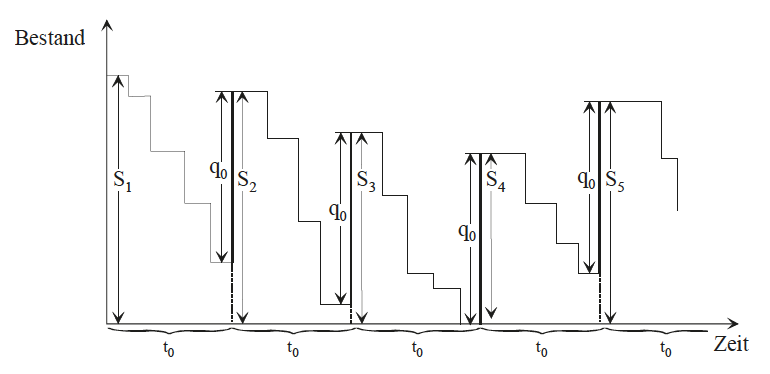
Hallo, wie kann ich in meiner Abbildung Pfeile unterbrechen und diese beschriften, ohne den Hintergrund der Beschriftung auf weiß setzen zu müssen? Mein Problem bei meiner aktuellen Variante ist, dass dadurch auch andere Teile der Abbildung weiß werden. Folgenden Code verwende ich (einige Punkte sind hier leicht verändert): \documentclass[final, english, ngerman, a4paper]{scrreprt} \usepackage{tikz,pgfplots} \pgfplotsset{compat=newest} \usetikzlibrary{arrows,trees,graphs,positioning, arrows, chains, shapes} \begin{document} \begin{figure} \begin{tikzpicture} [>=stealth] \tikzstyle{clip} = [decorate,decoration={brace, mirror, amplitude=7pt,raise=0.05cm}] \tikzstyle{Node} = [pos=0.5, anchor = north, yshift = -0.55cm] %Geschweifte Klammern x-Achse \draw [clip] (0,0) -- (2.5,0) node [Node] {$t_0$}; \draw [clip] (2.5,0) -- (5,0) node[Node] {$t_0$}; \draw [clip](5,0) -- (7.5,0) node[Node] {$t_0$}; \draw [clip] (7.5,0) -- (10,0) node[Node] {$t_0$}; \draw [clip](10,0) -- (12.5,0) node[Node] {$t_0$}; % Lagerbestand \draw [thick] (2.5,1.2) -- (2.5,4.6); \draw [thick, dotted] (2.5,0) -- (2.5,1.2); \draw [thick] (5,0.4) -- (5,3.7); \draw [thick, dotted] (5,0) -- (5,0.4); \draw [thick] (7.5,0) -- (7.5,3.4); \draw [thick] (10,0.8) -- (10,4.4); \draw [thick, dotted] (10,0) -- (10,0.8); \draw [mark=*] (0,5) -- (0.4,5) -- (0.4,4.5) -- (0.9,4.5) -- (0.9,3.4) -- (1.5,3.4) -- (1.5,2.5) -- (2,2.5) -- (2,1.2) -- (2.5,1.2); \draw [mark=*] (2.2,4.6) -- (3.2,4.6) -- (3.2,3.7) -- (3.8,3.7) -- (3.8,2.1) -- (4.3,2.1) -- (4.3,0.4) -- (5,0.4); \draw [mark=*] (4.7,3.7) -- (5.5,3.7) -- (5.5,2.6) -- (6,2.6) -- (6,1) -- (6.5,1) -- (6.5,0.7) -- (7,0.7) -- (7,0); \draw [mark=*] (7.2,3.4) -- (8.2,3.4) -- (8.2,2.4) -- (8.9,2.4) -- (8.9,1.6) -- (9.4,1.6) -- (9.4,1) -- (9.8,1); \draw [mark=*] (9.7,4.4) -- (11,4.4) -- (11, 3.3) -- (11.4,3.3) -- (11.4,2.3); \draw [<->, ultra thin] (0.2,0) -- (0.2,5) node[midway,sloped,rotate=270,fill=white, anchor=center, pos=0.55] {$S_1$}; \draw [<->, ultra thin] (2.7,0) -- (2.7,4.6) node[midway,sloped,rotate=270,fill=white, anchor=center, pos=0.6] {$S_2$}; \draw [<->, ultra thin] (5.2,0) -- (5.2,3.7) node[midway,sloped,rotate=270,fill=white, anchor=center, pos=0.6] {$S_3$}; \draw [<->, ultra thin] (7.7,0) -- (7.7,3.4) node[midway,sloped,rotate=270,fill=white, pos=0.6] {$S_4$}; \draw [<->, ultra thin] (10.2,0) -- (10.2,4.4) node[sloped,rotate=270,fill=white, pos=0.6] {$S_5$}; \draw [<->, ultra thin] (2.3,1.2) -- (2.3,4.6) node[midway,sloped,rotate=270,fill=white, anchor=center, pos=0.55] {$q_0$}; \draw [<->, ultra thin] (4.8,0.4) -- (4.8,3.7) node[midway,sloped,rotate=270,fill=white, anchor=center, pos=0.55] {$q_0$}; \draw [<->, ultra thin] (7.3,0) -- (7.3,3.4) node[midway,sloped,rotate=270,fill=white, anchor=center, pos=0.55] {$q_0$}; \draw [<->, ultra thin] (9.8,1) -- (9.8,4.4) node[midway,sloped,rotate=270,fill=white, anchor=center, pos=0.55] {$q_0$}; % Koordinatensystem \draw[->,>=stealth,thick] (0,0) -- (12.5,0) node[below=0.2] {Zeit}; \draw[->,thick] (0,0) -- (0,6) node[below left=0.3,anchor=east] {Bestand}; \end{tikzpicture} \end{figure} \end{document} So sieht es nach dem kompilieren aus:
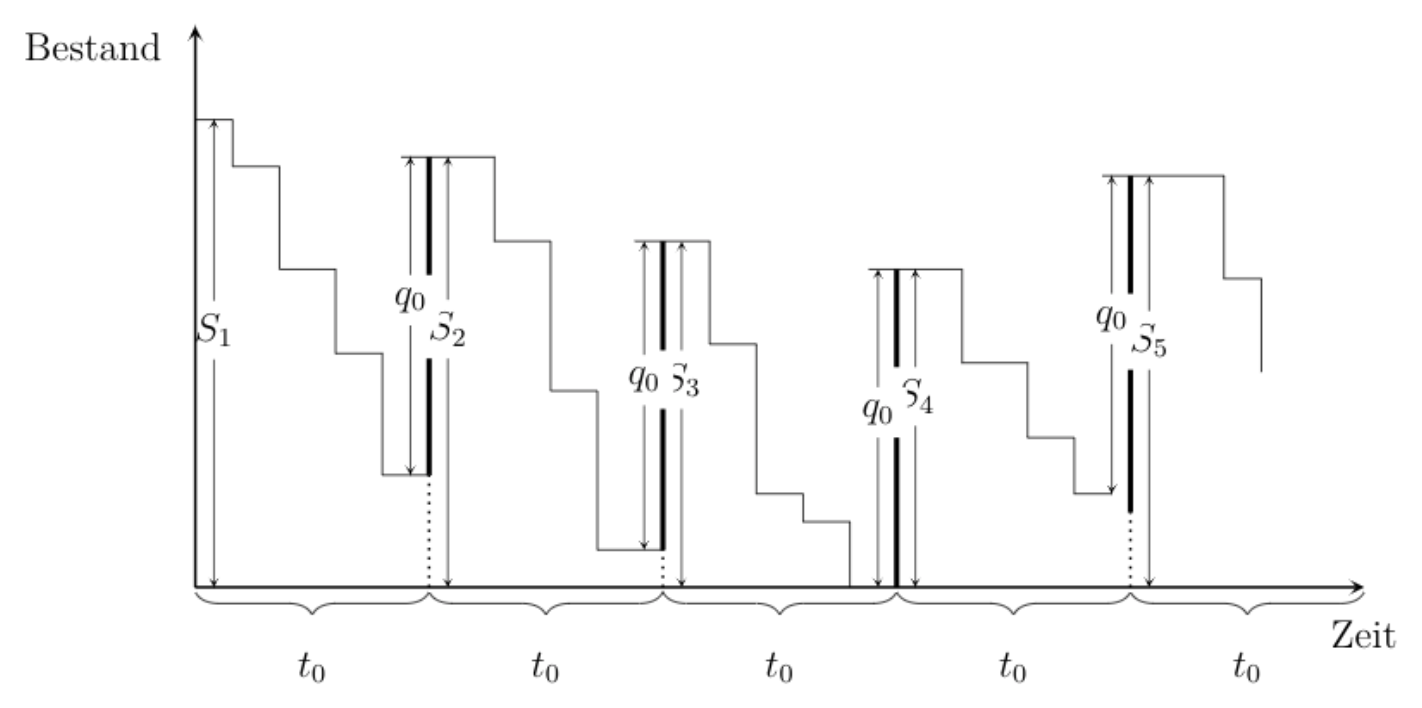
So möchte ich es haben:
Gibt es außerdem einen Trick, wie ich die letzte geschwungene Klammer auf der x-Achse vorher schon aufgehört bekomme und die Pfeilgrößen größer setze? |
|
Du kannst \documentclass[margin=5pt]{standalone} \usepackage{tikz} \begin{document} \begin{tikzpicture} \fill[blue!20](-1,0)rectangle(1,3); \draw [<->,thick] (0,0) -- (0,3) node [thin, pos=0.6, path picture={\draw[white, line width=2pt,-] (path picture bounding box.south)--(path picture bounding box.north); } ] {$S_1$}; \end{tikzpicture} \end{document} Oder mit Deinem Beispiel, in dem ich ein paar \documentclass{scrreprt} \usepackage{tikz}% pgfplots lädt auch tikz, wobei tikz hier reicht \usetikzlibrary{arrows.meta,decorations.pathreplacing} \begin{document} \begin{figure} \begin{tikzpicture} [>=Stealth] \tikzset{ klammer/.style={decorate,decoration={brace, mirror, amplitude=7pt,raise=0.05cm}}, } % Koordinatensystem \draw[->,>=Stealth,thick] (0,0) -- (12.5,0) node[below=0.2] {Zeit}; \draw[->,thick] (0,0) -- (0,6) node[below left=0.3,anchor=east] {Bestand}; %Geschweifte Klammern x-Achse \begin{scope} [nodes={pos=0.5, anchor = north, yshift = -0.55cm}] \foreach [remember=\x as \lastx initially 0] \x in {2.5,5,...,10} {\draw [klammer] (\lastx,0) -- (\x,0) node {$t_0$};} \clip(current bounding box.south west)rectangle(11.75,0);% wird durch scope lokal gehalten \draw[klammer] (10,0) -- (12.5,0) node {$t_0$}; \end{scope} % Lagerbestand \begin{scope}[thick] \draw (2.5,1.2) -- (2.5,4.6); \draw [dotted] (2.5,0) -- (2.5,1.2); \draw (5,0.4) -- (5,3.7); \draw [dotted] (5,0) -- (5,0.4); \draw (7.5,0) -- (7.5,3.4); \draw (10,0.8) -- (10,4.4); \draw [dotted] (10,0) -- (10,0.8); \end{scope} \draw (0,5) -- (0.4,5) -- (0.4,4.5) -- (0.9,4.5) -- (0.9,3.4) -- (1.5,3.4) -- (1.5,2.5) -- (2,2.5) -- (2,1.2) -- (2.5,1.2); \draw (2.2,4.6) -- (3.2,4.6) -- (3.2,3.7) -- (3.8,3.7) -- (3.8,2.1) -- (4.3,2.1) -- (4.3,0.4) -- (5,0.4); \draw (4.7,3.7) -- (5.5,3.7) -- (5.5,2.6) -- (6,2.6) -- (6,1) -- (6.5,1) -- (6.5,0.7) -- (7,0.7) -- (7,0); \draw (7.2,3.4) -- (8.2,3.4) -- (8.2,2.4) -- (8.9,2.4) -- (8.9,1.6) -- (9.4,1.6) -- (9.4,1) -- (9.8,1); \draw (9.7,4.4) -- (11,4.4) -- (11, 3.3) -- (11.4,3.3) -- (11.4,2.3); \begin{scope}[<->,ultra thin, nodes={path picture={ \draw[white, line width=2pt,-] (path picture bounding box.south)--(path picture bounding box.north); }} ] \foreach [count=\i] \x/\y in { 0.2/5, 2.7/4.6, 5.2/3.7, 7.7/3.4, 10.2/4.4 }{\draw (\x,0) -- (\x,\y) node [pos=.6] {~$S_\i$};} \foreach \x/\yl/\yh in { 2.3/1.2/4.6, 4.8/.4/3.7, 7.3/0/3.4, 9.8/1/4.4 }{\draw (\x,\yl) -- (\x,\yh) node [pos=.55] {$q_0$\,};} \end{scope} \end{tikzpicture} \end{figure} \end{document} Die letzte geschweifte Klammer kannst Du mit Wenn die Größen der Pfeilspitzen angepasst werden sollen, kannst Du Du kannst aber auch auf das Übermalen verzichten. Dafür musst Du zunächst die Beschriftung positionieren und die Pfeile anschließend von diesem Node aus zeichnen: \documentclass[margin=5pt]{standalone} \usepackage{tikz} \begin{document} \begin{tikzpicture} \fill[blue!20](-1,0)rectangle(1,3); \path (0,0) -- (0,3) node [pos=.6] (h) {$S_1$}; \path (h) edge[->] (0,0) edge[->] (0,3); \end{tikzpicture} \end{document} Mit Deinem Beispiel: \documentclass{scrreprt} \usepackage{tikz}% pgfplots lädt auch tikz, wobei tikz hier reicht \usetikzlibrary{arrows.meta,decorations.pathreplacing} \begin{document} \begin{figure} \begin{tikzpicture} [>=Stealth] \tikzset{ klammer/.style={decorate,decoration={brace, mirror, amplitude=7pt,raise=0.05cm}}, } % Koordinatensystem \draw[->,>=Stealth,thick] (0,0) -- (12.5,0) node[below=0.2] {Zeit}; \draw[->,thick] (0,0) -- (0,6) node[below left=0.3,anchor=east] {Bestand}; %Geschweifte Klammern x-Achse \begin{scope} [nodes={pos=0.5, anchor = north, yshift = -0.55cm}] \foreach [remember=\x as \lastx initially 0] \x in {2.5,5,...,10} {\draw [klammer] (\lastx,0) -- (\x,0) node {$t_0$};} \clip(current bounding box.south west)rectangle(11.75,0);% wird durch scope lokal gehalten \draw[klammer] (10,0) -- (12.5,0) node {$t_0$}; \end{scope} % Lagerbestand \begin{scope}[thick] \draw (2.5,1.2) -- (2.5,4.6); \draw [dotted] (2.5,0) -- (2.5,1.2); \draw (5,0.4) -- (5,3.7); \draw [dotted] (5,0) -- (5,0.4); \draw (7.5,0) -- (7.5,3.4); \draw (10,0.8) -- (10,4.4); \draw [dotted] (10,0) -- (10,0.8); \end{scope} \draw (0,5) -- (0.4,5) -- (0.4,4.5) -- (0.9,4.5) -- (0.9,3.4) -- (1.5,3.4) -- (1.5,2.5) -- (2,2.5) -- (2,1.2) -- (2.5,1.2); \draw (2.2,4.6) -- (3.2,4.6) -- (3.2,3.7) -- (3.8,3.7) -- (3.8,2.1) -- (4.3,2.1) -- (4.3,0.4) -- (5,0.4); \draw (4.7,3.7) -- (5.5,3.7) -- (5.5,2.6) -- (6,2.6) -- (6,1) -- (6.5,1) -- (6.5,0.7) -- (7,0.7) -- (7,0); \draw (7.2,3.4) -- (8.2,3.4) -- (8.2,2.4) -- (8.9,2.4) -- (8.9,1.6) -- (9.4,1.6) -- (9.4,1) -- (9.8,1); \draw (9.7,4.4) -- (11,4.4) -- (11, 3.3) -- (11.4,3.3) -- (11.4,2.3); \begin{scope}[ultra thin,every edge/.append style={->}] \foreach [count=\i] \x/\y in { 0.2/5, 2.7/4.6, 5.2/3.7, 7.7/3.4, 10.2/4.4 }{ \path (\x,0) -- (\x,\y) node (h) [pos=.6] {~$S_\i$}; \path (h) edge (\x,0) edge (\x,\y); } \foreach \x/\yl/\yh in { 2.3/1.2/4.6, 4.8/.4/3.7, 7.3/0/3.4, 9.8/1/4.4 }{ \path (\x,\yl) -- (\x,\yh) node (h) [pos=.55] {$q_0$\,}; \path (h) edge (\x,\yl) edge (\x,\yh); } \end{scope} \end{tikzpicture} \end{figure} \end{document} Vielen Dank für die super ausführliche Antwort! Das hat mir wirklich sehr geholfen!
(28 Mai '21, 08:38)
latex_starter98
|

Der letzte Satz in der Frage ist eigentlich zwei eigene Fragen. Wir haben reichlich Platz für gaaaaaanz viele Fragen. Es gibt also keinen guten Grund, mehrere Fragen in eine zu quetschen. Darunter leidet nur die Übersichtlichkeit.
@saputello: Danke für den Hinweis! Dann werde ich die nachmal einzeln formulieren, damit es übersichtlich bleibt.