
|
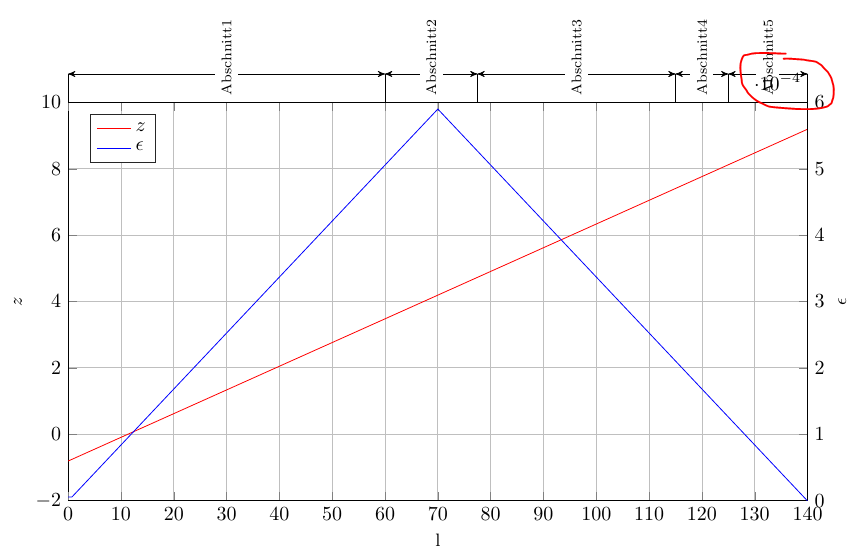
Guten Tag, weiss jemenad wie man die Zehnerpotenz rechts neben die zweite y-Achse verschieben kann?
\documentclass{article} \usepackage{tikz} \usetikzlibrary{arrows} \usepackage{pgfplots} %axis \pgfplotsset{compat=newest} \begin{document} \begin{tikzpicture} \begin{axis}[ width=13cm, height=7cm, at={(0,0)}, scale only axis, axis y line*=left, xmin=0, xmax=140, ymin=-2, ymax=10, xlabel style={font=\small}, xlabel={l}, ylabel style={font=\small}, ylabel={$z$}, axis background/.style={fill=white}, xmajorgrids, ymajorgrids, ] \addplot [color=red] table[row sep=crcr]{% 0 -0.808648568650824\\ 140.01 9.1935736290271\\ }; \label{plot_one} \end{axis} \coordinate (v0) at (0,7); \coordinate (v1) at (0,7.5); \draw (v0) -- (v1); \coordinate (v2) at ({60*13/140},7.5) {}; \draw[<->, >=stealth'] (v1) -- (v2) node[midway,yshift=-5mm, fill=white, right,rotate=90, font=\scriptsize] {Abschnitt1}; \coordinate (v3) at ({77.5*13/140},7.5); \draw[<->, >=stealth'] (v3) --(v2) node[midway,yshift=-5mm, fill=white,right ,rotate=90, font=\scriptsize] {Abschnitt2}; \coordinate (v5) at ({60*13/140},7); \coordinate (v4) at ({77.5*13/140},7); \draw (v4) -- (v3); \draw (v2) -- (v5); \coordinate (v6) at ({115*13/140},7.5); \coordinate (v7) at ({115*13/140},7); \draw (v6) -- (v7); \draw[<->, >=stealth'] (v3) -- (v6) node[midway,yshift=-5mm, fill=white,right,rotate=90, font=\scriptsize,text width=1cm] {Abschnitt3}; \coordinate (v8) at ({125*13/140},7.5); \coordinate (v9) at ({125*13/140},7); \draw (v8) -- (v9); \draw[<->, >=stealth'] (v6) -- (v8) node[midway,yshift=-5mm, fill=white,right ,rotate=90, font=\scriptsize,text width=1cm] {Abschnitt4}; \coordinate (v10) at ({140*13/140},7.5); \coordinate (v11) at ({140*13/140},7); \draw (v10) -- (v11); \draw[<->, >=stealth'] (v8) -- (v10) node[midway,yshift=-5mm, fill=white,right ,rotate=90, font=\scriptsize,text width=1cm] {Abschnitt5}; % \begin{axis}[ width=13cm, height=7cm, at={(0,0)}, scale only axis, %axis y line=left, axis y line*=right, xmin=0, xmax=140, ymin=0, ymax=0.0006, xticklabels=none, ylabel style={font=\small}, ylabel={$\epsilon$}, % hiermit lässt sich die Beschriftung nur als Ganzes verschieben % ticklabel style={ % draw, % added just for example % anchor=south east, % xshift=2pt, % yshift=-2pt, % you have -2pt here % }, legend style={at={(0.03,0.97)}, anchor=north west, legend cell align=left, align=left, draw=white!15!black} ] \addlegendimage{/pgfplots/refstyle=plot_one}\addlegendentry{$z$} \addplot [color=blue] table[row sep=crcr]{% 0 5.27610580989668e-06\\ 0.707121212121212 5.30333721330517e-06\\ 70 0.00059\\ 140.01 -6.94394699371304e-07\\ }; \addlegendentry{$\epsilon$} \end{axis} \end{tikzpicture}% \end{document} |
|
Du setzt das m.E. an Stellen relativ codeintensiv um.
Hinweis: Damit man die Achsen unterscheiden kann habe ich sie farbig gemacht. Zum Problem: Das Problem der schlecht gesetzten Zehnerpotenz rührt von dem Stern in % Problem ======================= %axis y line*=right,% vermeidet Achsenpfeil, aber setzt Zehnerpotenz ungünstig axis y line=right, % setzt Zehnerpotenz gut, aber erzeugt Achsenpfeil axis line style={-}, % beseitigt Achsenpfeil % =============================
\documentclass{article} \usepackage{tikz} \usetikzlibrary{backgrounds} \usetikzlibrary{arrows} \usepackage{pgfplots} \pgfplotsset{compat=newest, % Globale, gemeinsame Schlüssel label style={font=\small}, width=13cm, height=7cm, % optional, bei Bedarf auskommentieren %at={(0,0)}, % kein Effekt } \begin{document} \begin{tikzpicture}[ >=stealth', ] \begin{axis}[ scale only axis, axis y line*=left, xmin=0, xmax=140, ymin=-2, ymax=10, xlabel={l}, ylabel={$z$}, xmajorgrids, ymajorgrids, ] \addplot [color=red] table[row sep=crcr]{ 0 -0.808648568650824\\ 140.01 9.1935736290271\\ }; \label{plot_one} \end{axis} % 2. y-Achse \begin{axis}[orange, % auskommentieren! scale only axis, % Problem ======================= %axis y line*=right,% vermeidet Achsenpfeil, aber setzt Zehnerpotenz ungünstig axis y line=right, % setzt Zehnerpotenz gut, aber erzeugt Achsenpfeil axis line style={-}, % beseitigt Achsenpfeil % ============================= axis x line=none, % ergänzt xmin=0, xmax=140, ymin=0, ymax=0.0006, xticklabels=none, ylabel={$\epsilon$}, legend style={at={(0.03,0.97)}, anchor=north west, legend cell align=left, align=left, draw=white!15!black} ] \addlegendimage{/pgfplots/refstyle=plot_one}\addlegendentry{$z$} \addplot [color=blue] table[row sep=crcr]{ 0 5.27610580989668e-06\\ 0.707121212121212 5.30333721330517e-06\\ 70 0.00059\\ 140.01 -6.94394699371304e-07\\ }; \addlegendentry{$\epsilon$} \end{axis} % 2. x-Achse mit Annotationen und Bemaßungspfeilen \begin{axis}[purple, % auskommentieren! clip=false, % notwendig scale only axis, axis y line=none, axis x line*=top, xmin=0, xmax=140, ymin=-2, ymax=10, % verlangt xtick={30, 69, 97, 120, 133},% xticklabels={Abschnitt 1 ,Abschnitt 2, Abschnitt 3, Abschnitt 4, Abschnitt 5}, xticklabel style={ anchor=west, font=\scriptsize, rotate=90, draw=none, inner sep=3pt, xshift=3pt, fill=white, }, ] \begin{scope}[on background layer] \foreach \u/\v in {0/60, 60/78, 78/115, 115/125, 125/140}{%% <---- Wertepaare überprüfen! \edef\temp{ \noexpand\draw[<->] (\u,11) -- (\v,11); \noexpand\draw[] (\u,10) -- (\u,11); \noexpand\draw[] (\v,10) -- (\v,11); }\temp }%% \end{scope} \end{axis} \end{tikzpicture} \end{document} |


Benutze den Stil
y tick scale label style, den Du im Abschnitt 4.18.1 "All Supported Styles" der Dokumentation vonpgfplotsfindest.