|
Habe ein Daten-File der Form:
Jetzt möchte ich in dem dreidimensionalen Koordinaten (p,T,phi) zum Beispiel die Werte von rho farblich darstellen. Dazu möchte ich mich des Scatterplots bedienen und den Marker mit einer Colormap über den Wert rho einfärben. \begin{figure}[!htb] \centering \begin{tikzpicture} \begin{axis}[ view={120}{40}, width=220pt, height=220pt, grid=major, z buffer=sort, xlabel={$l_1$}, ylabel={$l_2$}, zlabel={$l_3$}, point meta={explicit=table[a=rho]{data/Stoffwerte/Stoffwerte.dat}}, colormap/bluered,colorbar, scatter/use mapped color={ draw=mapped color,fill=mapped color!70}, ] \addplot3[only marks,scatter,mark=ball*,mark size=10] table[x=p,y=T,z=phi] {data/Stoffwerte/Stoffwerte.dat}; \end{axis} \end{tikzpicture} \end{figure} Leider funktioniert das so gar nicht, wie ich es mir vorstelle und habe jetzt auch so langsam keine Idee mehr, wie ich den Wert am Punkt (p,T,phi) eingefärbt bekomme mit dem Wert von rho.
Dieser Frage ist "Community Wiki" markiert.
|
|
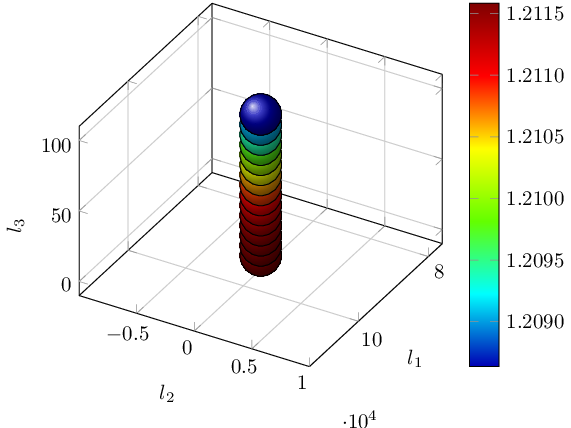
Das funktioniert so, dass man Hinzu kommt, dass es meines Wissens gar keinen Marker namens \documentclass{standalone} \usepackage{pgfplots} \pgfplotsset{compat=1.11} \begin{document} \begin{tikzpicture} \begin{axis}[ view={120}{40}, width=220pt, height=220pt, grid=major, z buffer=sort, xlabel={$l_1$}, ylabel={$l_2$}, zlabel={$l_3$}, point meta=explicit, colormap/bluered,colorbar, colorbar style={/pgf/number format/precision=4,/pgf/number format/fixed zerofill}, scatter/use mapped color={ball color=mapped color}, %draw=mapped color,fill=mapped color!70}, ] \addplot3[only marks,scatter,mark=ball,mark size=10] table[x=p,y=T,z=phi,meta=rho] { p T phi rho eta nu 95000.000000000 0.000000000 0.000000000 1.211581814 0.000017239 0.000014229 95000.000000000 0.000000000 7.142857143 1.211566785 0.000017229 0.000014221 95000.000000000 0.000000000 14.285714286 1.211521700 0.000017219 0.000014213 95000.000000000 0.000000000 21.428571429 1.211446558 0.000017210 0.000014206 95000.000000000 0.000000000 28.571428571 1.211341358 0.000017200 0.000014199 95000.000000000 0.000000000 35.714285714 1.211206102 0.000017190 0.000014192 95000.000000000 0.000000000 42.857142857 1.211040789 0.000017180 0.000014186 95000.000000000 0.000000000 50.000000000 1.210845419 0.000017170 0.000014180 95000.000000000 0.000000000 57.142857143 1.210619993 0.000017161 0.000014175 95000.000000000 0.000000000 64.285714286 1.210364509 0.000017151 0.000014170 95000.000000000 0.000000000 71.428571429 1.210078968 0.000017141 0.000014165 95000.000000000 0.000000000 78.571428571 1.209763371 0.000017131 0.000014161 95000.000000000 0.000000000 85.714285714 1.209417716 0.000017121 0.000014157 95000.000000000 0.000000000 92.857142857 1.209042005 0.000017112 0.000014153 95000.000000000 0.000000000 100.000000000 1.208636237 0.000017102 0.000014150 }; \end{axis} \end{tikzpicture} \end{document}
Ich habe die Formatierung fuer die |