Das ist schon möglich – allerdings erfordert es einiges "Hand anlegen", damit man die Tabelle und den Plot synchronisiert. Helfen kann hier pgfplotstable, ein Generator für LaTeX tabular-Umgebungen.
Pgfplotstable liest dieselben Daten wie der plot, der kann die Tabelle transponieren (Zeilen und Spalten vertauschen), kann jede Zelle formatieren oder sogar fortgeschrittene Logik zum Definieren der Zellinhalte akzeptieren, und liefert am Ende eine tabular Umgebung.
Meine Idee ist, dass man im Plot die x Unit und die Breite einer Tabellenspalte auf denselben Wert \UNIT setzt. Der bestimmt dann natürlich die Breite der gesamten Abbildung.
Das, was ich da jetzt ausprobiert habe, hat doch einiges an Zeilen (auch wegen den Kommentaren)... ich hoffe, es ist trotzdem nützlich.
\documentclass{article}
\usepackage{array}
\usepackage{pgfplotstable}
\usepackage{pgfplots}
\pgfplotsset{compat=1.8}
\usepackage{tikz}
\usepackage{filecontents}
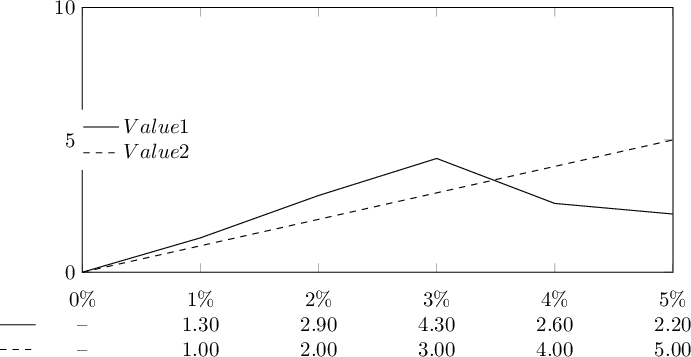
\begin{filecontents}{test.dat}
i value1 value2
0 0.0 0.0
1 1.3 1.0
2 2.9 2.0
3 4.3 3.0
4 2.6 4.0
5 2.2 5.0
\end{filecontents}
\begin{document}
\thispagestyle{empty}
% "First width" is the width of the first column. The first column
% should be BEFORE the plot, i.e. before the "x=0" line:
\def\FIRSTWIDTH{0.4cm }
%
% "Unit" is the width of one unit in the axis:
\def\UNIT{2cm }
\noindent
% align properly. This works if and only if we have 'trim axis left' (see below)
\pgfmathparse{%
\FIRSTWIDTH% the first column is just description.
+0.5*\UNIT% and: our table *centers* the units. the 0.5*unit respects the centering.
}%
\hspace{\pgfmathresult pt }%
%
\begin{tikzpicture}[
% excludes everything left of the left axis line from the
% picture's bounding box such that we have a well-defined bounding
% box:
trim axis left
]
\begin{axis}[
% define a suitable width. This is to sync-up with the table:
x=\UNIT,
%xticklabel=\pgfmathprintnumber\tick\%,
% SUPPRESS tick labels. We show all x ticks in the table, see below:
xticklabel=\empty,
width=\linewidth,
height=0.5\linewidth,
xmax=5,
xmin=0,
xtick={0,1,...,5},
ymax=10,
ymin=0,
ytick={0,5,10},
legend style={at={(0.2,0.5)},anchor=east,draw=none},
]
\addplot[solid] table [x=i,y=value1]{test.dat};
\label{plot:value1}
\addlegendentry{$Value 1$}
\addplot[dashed] table [x=i,y=value2]{test.dat};
\label{plot:value2}
\addlegendentry{$Value 2$}
\end{axis}
\end{tikzpicture}
\noindent
% Now the tabluar....
\pgfplotstableread{test.dat}\loadedtable
% we want to transpose it, ok.
\pgfplotstabletranspose{\transposed}{\loadedtable}%
%
% now we want to type set the *transposed* table:
\pgfplotstabletypeset[
% suppress the header row (contains column names):
every head row/.style={output empty row},
%
% skip the first row (which would be the X coordinates:
%skip rows between index={0}{1},
%
% replace '0.0' by '--' :
string replace={0.0}{},empty cells with=--,
%
% insert the small legend images in the column named 'colnames'
% (auto-generated by 'transpose':
columns/colnames/.style={
assign cell content/.code={%
\ifnum\pgfplotstablerow=0
% ... the first row contains the x ticks; keep it empty:
\pgfkeyssetvalue{/pgfplots/table/@cell content}{ }%
\else
% we can get the legend images here since I added
% "\label{plot:<columnname>}" right below all plots
% (see the plot):
\pgfkeyssetvalue{/pgfplots/table/@cell content}{\ref{plot:##1}}%
\fi
},
% suppress the column name on top:
column name=,
% configure the width of the first column:
column type={@{}p{\FIRSTWIDTH}},
},
%
% Here is the cell content for all but the first column (the first
% has its extra style, see above):
assign cell content/.code={%
\def\pgfmathresult{#1}% #1 is the cell's "raw" content
\ifx\pgfmathresult\empty
% Ah - the cell is empty. Keep it that way.
\else
\ifnum\pgfplotstablerow=0
% ah: the first row. That should be formatted in a
% special way as it is the tick label:
\pgfmathprintnumberto[fixed]{#1}\pgfmathresult
% append "\%" to \pgfmathresult:
\expandafter\def\expandafter\pgfmathresult\expandafter{\pgfmathresult \%}%
\else
% any but the first row:
\pgfmathprintnumberto[fixed zerofill]{#1}\pgfmathresult
\fi
\fi
% store our value.
\pgfkeyslet{/pgfplots/table/@cell content}\pgfmathresult%
},
% column type for all but the first:
% - @{} discards space between columns
% - p{\UNIT} makes a left-align column of the prescribed with
% - >{\centering\arraybackslash}...
% causes the following column to be CENTERED
column type={@{}>{\centering\arraybackslash}p{\UNIT}},
%
% shows the resulting tabular code in the log file:
debug,
]{\transposed}
\end{document}
Den gesamten Code für die Tabelle kann man im Grunde in ein Makro auslagern, da er nur noch von dem Eingabe Dateinamen abhängt. Er erwartet noch, dass jeder Plot mit \label markiert ist und dass \FIRSTWIDTH und \UNIT definiert sind (und bei der Platzierung der Abbildung, wie dokumentiert, respektiert wurde).
Referenzen:
beantwortet
21 Dez '13, 15:34

cfeuersaenger
3.7k●2●3
Akzeptiert-Rate:
34%


Da drängt sich mir der Hinweis auf
pgfplotstableauf. Außerdem gibt es AFAIK schon Version 1.9 vonpgfplots