
|
Ich verwende
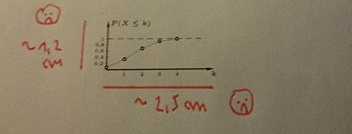
Woran liegt das? \documentclass[paper=a5]{scrartcl} %\documentclass[border=2pt, varwidth]{standalone} \usepackage{pgfplots} \pgfplotsset{compat=1.10}% derzeit aktuelle Version %\pgfplotsset{compat=newest}% Overleaf hat nur Version 1.11 \usepackage{filecontents} \begin{filecontents}{data.csv} 5 0 0.59049 0.32768 0.23730 0.16807 0.07776 0.03125 5 1 0.91854 0.73728 0.63281 0.52822 0.33696 0.18750 5 2 0.99144 0.94208 0.89648 0.83692 0.68256 0.50000 5 3 0.99954 0.99328 0.98438 0.96922 0.91296 0.81250 5 4 0.99999 0.99968 0.99902 0.99757 0.98976 0.96875 \end{filecontents} % Skalierbare Schrift \usepackage{lmodern} \newcommand\mini{\fontsize{2.5pt}{3pt}\selectfont} \newcommand\Mini{\fontsize{3.5pt}{3pt}\selectfont} \usepackage{lipsum} \begin{document} % Pfeil aus Technisches Zeichnen \usetikzlibrary{arrows.meta} \tikzset{ >={Triangle[length=0pt 9.0009,width=0pt 3.0003]}, } \pgfplotsset{ % override ``-stealth'' for open axes every non boxed x axis/.append style={ x axis line style={->} }, every non boxed y axis/.append style={ y axis line style={->} }, every non boxed z axis/.append style={ z axis line style={->} } } % ================== \pgfplotsset{mystyle/.style={% % allgemein % ybar interval,%=10pt, ? % Balkendiagramm /pgf/number format/use comma, % Kommas als Zahlentrennzeichen % x und y axis lines = middle,% < Achsenstil so früh wie möglich einstellen - er ändert weitere Optionen axis line style={->}, %y axis line style={-latex}, ticklabel style = {font=\tiny}, major tick length =2pt, % x xmin=0, xmax=5, xtick=data, % hide obscured x ticks=false,% <- zum Anzeigen des Ticklabels 0 % TUT NET xlabel style={anchor=north, font=\Mini,}, enlarge x limits={abs=10pt,upper},% <- damit die Pfeilspitze an der y-Achse sichtbar ist xticklabel style = {yshift=0.5pt, font=\mini}, % y ymin=0, ymax=1, ytick = {0.2, 0.4, ..., 1}, ytickmax=1,% <- kein Tick oberhalb von y=.9 ylabel style={anchor=north west, yshift=1ex, font=\Mini,}, enlarge y limits={abs=10pt,upper}, yticklabel style = {xshift=0.5pt, font=\mini}, }}% \begin{tikzpicture}[ scale=1.0, %inner sep=2pt, %outer sep=2pt, ] \begin{axis}[mystyle, width=3.5cm, height=2.5cm, xlabel={$k$}, ylabel={$P(X \leq k)$}, ] \addplot[draw=gray, thin, mark=*, mark size=0.75pt, mark options = {draw=black, fill=white, thin}] table [x index=1, y index=6] {data.csv}; \addplot[draw=black, ultra thin, densely dashdotted, domain=0:5.5] {1}; \end{axis} \end{tikzpicture} \end{document} |
|
Für das Beispiel aus der Frage bedeutet dies \begin{axis}[ scale only axis=true, width=3.5cm, height=2.5cm,… |
