
|
In dem Thread wurde mit viel Aufwand eine Lösung angegeben, mit der die Platzhalter x und y sauber an der Pfeilspitze stehen bleiben.
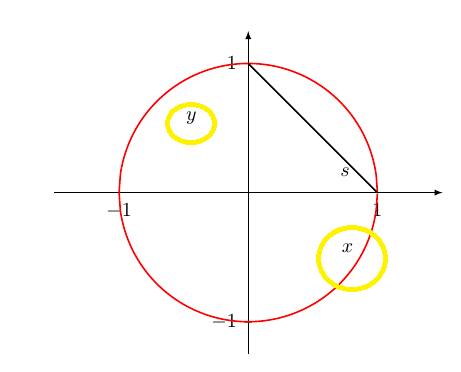
Wieso pflanzt es mir x und y wieder irgendwo in die Landschaft, sobald ich
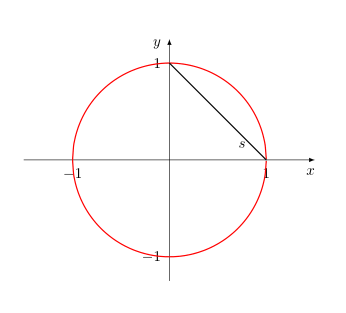
\documentclass{article} \usepackage[ngerman]{babel} \usepackage{tikz} % \usetikzlibrary{matrix} \usepackage{pgfplots} \begin{document} \begin{tikzpicture}[scale=0.75,]%transform shape \begin{axis}[ %width=4cm, height=4cm, % allgm.: xmin = -1.25, xmax = 1.25, ymin = -1.25, ymax = 1.25, samples = 200, axis lines = middle, axis equal, axis line style = {-latex}, % Pfeilspitzen % x-Achse xlabel = {$x$}, %xlabel style= right, xtick={-1,...,1}, %y-Achse ylabel = {$y$}, %ylabel style= {above} ytick={-1,...,1}, % Achsenbezeichnung xlabel style={ yshift=-.5*\pgfkeysvalueof{/pgfplots/major tick length}, anchor=north east, inner xsep=0pt }, ylabel={\normalsize $y$}, ylabel style={ xshift=-.5*\pgfkeysvalueof{/pgfplots/major tick length}, anchor=north east, inner ysep=0pt }, ] % Funktionen % Kreis oben \addplot [domain = -1:1, smooth, red, thick]{(1 - x^2)^0.5}; % Kreis oben \addplot [domain = -1:1, smooth, red, thick]{-(1 - x^2)^0.5}; % Strecke / Sekante \draw[thick] (axis cs:1,0) -- (axis cs: 0,1) node[near start, below]{$s$}; \end{axis} \end{tikzpicture} \end{document} |
|
Setze direkt nach dem Laden von \documentclass{article} \usepackage{pgfplots}% lädt auch tikz \pgfplotsset{compat=1.14} \begin{document} \begin{tikzpicture}[scale=0.75] \begin{axis}[ xmin = -1.25, xmax = 1.25, ymin = -1.25, ymax = 1.25, samples = 200, axis lines = middle, axis equal, axis line style = {-latex}, xlabel = {$x$}, xtick={-1,...,1}, ylabel = {$y$}, ytick={-1,...,1}, xlabel style={ yshift=-.5*\pgfkeysvalueof{/pgfplots/major tick length}, anchor=north east, inner xsep=0pt }, ylabel={\normalsize $y$}, ylabel style={ xshift=-.5*\pgfkeysvalueof{/pgfplots/major tick length}, anchor=north east, inner ysep=0pt }, every axis plot/.append style={ domain = -1:1, smooth, thick, no markers } ] \addplot[red]{(1 - x^2)^0.5}; \addplot[red]{-(1 - x^2)^0.5}; \draw[thick](1,0) -- (0,1) node[near start, below]{$s$}; \end{axis} \end{tikzpicture} \end{document}
Wenn ich nicht wüsste, dass Du keinen Wert darauf legst, würde es für diese Antwort glatt ein paar hundert Punkte extra geben. ;-)
(06 Feb '17, 10:15)
saputello
|
|
Problem selbst gelöst. Man kann eine scope-Umgebung verwenden. transform shape entfällt dann. \begin{tikzpicture} \begin{scope}[scale=0.625] \begin{axis} .... .... .... \end{axis} \end{scope} \end{tikzpicture} |

Du hast
\pgfplotsset{compat=...}direkt nach dem Laden vonpgfplotsvergessen. Siehe auch Was bedeutet die Kompatibilitätsangabe "compat=..." bei pgfplots?. Dafür kannst Du das Laden vontikzweglassen. Das erledigtpgfplots.Ok. Aber hier nochmal die Realisierung, dass mein Problem (im alten Thread) durchaus realistisch war, weil die Achsenbezeichnungen (x und y) oft nicht konsistent gegen globale Formatierungen sind.