
|
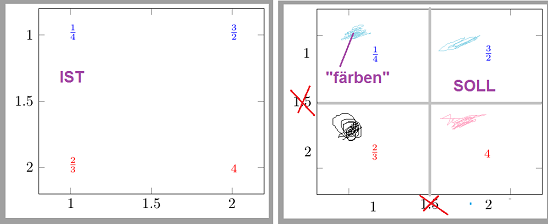
Ich denke, es sind nur ein paar triviale Einstellungen, die hier fehlen. Ich habe hier eine Beispielabelle (diese könnte auch mehr Zeilen haben) table[] { x y Z N color bgcolor 1 1 1 4 r R 1 2 2 3 s S 2 1 3 2 b B 2 2 4 1 b R }; und möchte daraus einen
Also ich komme so weit:
(wobei die Brüche noch nicht 100% richtig gefärbt sind) Was muss ich ändern, um einen richtigen
%\documentclass[]{article} \documentclass[border=3pt, varwidth]{standalone} \usepackage{pgfplots} \pgfplotsset{width=7cm,compat=1.13} \begin{document} % pgfplots.pdf, S. 115 \pgfplotsset{ZahlenAnzeigen/.style={ %TextFarben, nodes near coords*={ \pgfmathsetmacro{\Nenner}{int(\nenner)} \ifnum\Nenner=1 $\textcolor{red}{\pgfmathprintnumber[precision=0]\zaehler}$% \else ${\frac{\pgfmathprintnumber[precision=0]\zaehler} {\pgfmathprintnumber[precision=0]\nenner}}$% \fi}, every node near coord/.append style={xshift=0pt,yshift=-7pt, font=\footnotesize} }} \tikzset{TextFarben/.style={ r/.style={red}, b/.style={blue}, s/.style={black} }} \tikzset{HintergrundFarben/.style={ R/.style={red!50}, B/.style={blue!50}, S/.style={black!50} }} \begin{tikzpicture} \begin{axis}[enlargelimits=0.2] \addplot[matrix plot, %mark=*, only marks, % ohne das geht es nicht %point meta=\thisrow{color}, ZahlenAnzeigen, visualization depends on={\thisrow{Z} \as \zaehler}, visualization depends on={\thisrow{N} \as \nenner}, ] table[] { x y Z N color bgcolor 1 1 1 4 b B 1 2 2 3 s S 2 1 3 2 b B 2 2 4 1 r R }; \end{axis} \end{tikzpicture} \end{document} |
Folgen dieser Frage
Per E-Mail:Wenn sie sich anmelden, kommen Sie für alle Updates hier in Frage
Per RSS:Markdown-Grundlagen
- *kursiv* oder _kursiv_
- **Fett** oder __Fett__
- Link:[Text](http://url.com/ "Titel")
- Bild?
- nummerierte Liste: 1. Foo 2. Bar
- zum Hinzufügen ein Zeilenumbruchs fügen Sie einfach zwei Leerzeichen an die Stelle an der die neue Linie sein soll.
- grundlegende HTML-Tags werden ebenfalls unterstützt
 Doppelte Chance auf kostenloses Buch:
Mit Unterstützung durch DANTE e.V.: Deutschsprachige Anwendervereinigung TeX e.V. Danke den Mitgliedern!
LaTeX-Bücher als Willkommens-Geschenk für DANTE Neumitglieder. Mehr dazu: LaTeX.net/verein
Aktuelle Beiträge im Community-Blog:
- DANTE-Frühjahrstagung März 2026
- LaTeX Cookbook zweite Auflage erschienen
- Der Online-Compiler TeXlive.net
- Das Forum goLaTeX.de ist erneuert
- Einführung in ConTeXt
- Spielkarten mit LaTeX
- Weiterer CTAN Spiegel-Server
- Mathematisches Modell plotten
Diskussionsforen:
- goLaTeX (Deutsch)
- LaTeX.org (Englisch)
- TeXnique.fr (französisch)
Frage-Themen:
gestellte Frage: 17 Jan '18, 22:36
Frage wurde gesehen: 3,595 Mal
zuletzt geändert: 18 Jan '18, 23:11