
|
In einem table-plot Öffne in Overleaf
table[header=true, x index=1, y index=2, row sep=\\] {
Nr x y  \\
1 1 3             \\%0
2 0 2              \\%1
...
}
benenne ich die Punkte Öffne in Overleaf
nodes near coords style={%%
name=p\coordindex,
path picture={%
\coordinate[] (P\coordindex) at (p\coordindex.south);
},%
Wenn ich nun (außerhalb der axis Umgebung) klassisch darauf zurgreife, etwa Öffne in Overleaf
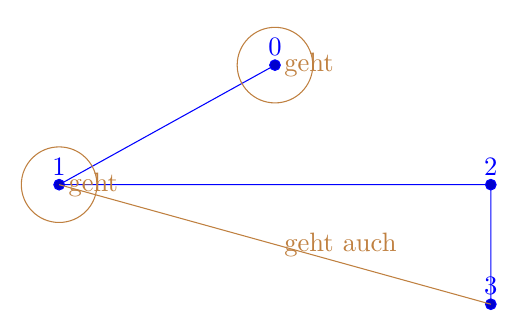
\draw[brown] (P0) circle[radius=5mm] node[right]{geht};
\draw[brown] (P1) -- (P3) node[midway, right]{geht auch};
ist das kein Problem. Frage: Wie kann ich die benannten Punkte in einem anderen plot verwenden? Das hier geht nicht. Ich vermute es ist eine Art protect-Problem oder ähnlich. Öffne in Overleaf
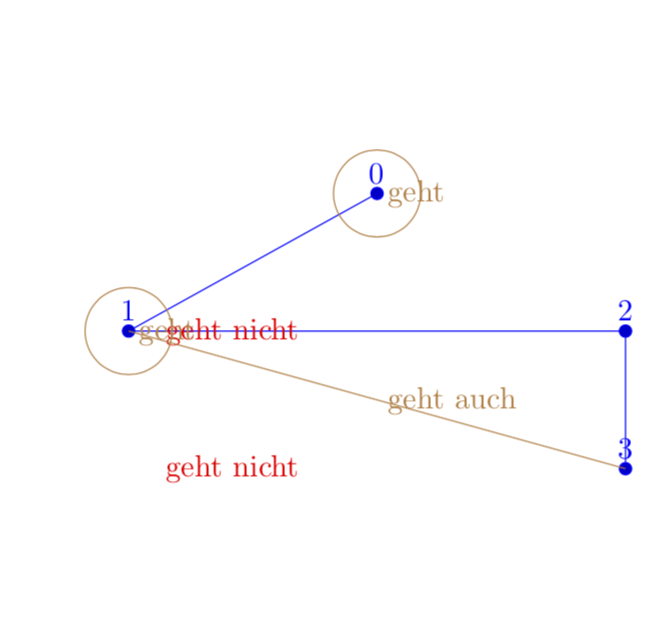
\addplot[no marks,
nodes near coords={},
%
% Versuch ......
visualization depends on={value \thisrowno{0} \as \punktnummer},
nodes near coords style={
path picture={
\draw[red, thick] (P\punktnummer) circle[radius=7mm] node[left]{geht nicht};
}},
]
table[header=true, x expr =0, y expr=0]{
Nr.
3
2
};
Vollständiges MWE: Öffne in Overleaf
\documentclass[margin=5mm, tikz]{standalone} \usetikzlibrary{angles} \usepackage{pgfplots} \usepgfplotslibrary{patchplots} \pgfplotsset{compat=1.13} \begin{document} \begin{tikzpicture} \begin{axis}[hide axis, colormap={Kantenfarbe}{color=(gray) color=(gray)}, ] % Zeichnung der Punkte ===================== \addplot+[nodes near coords=\coordindex, nodes near coords style={%% name=p\coordindex, path picture={% \coordinate[] (P\coordindex) at (p\coordindex.south); },% },%% ] table[header=true, x index=1, y index=2, row sep=\\] { Nr x y \\ 1 1 3 \\%0 2 0 2 \\%1 3 2 2 \\%2 4 2 1 \\%3 }; % Tabellarische Zeichnung von Annotationen ================= \addplot[no marks, nodes near coords={}, % % Versuch ...... visualization depends on={value \thisrowno{0} \as \punktnummer}, nodes near coords style={ path picture={ \draw[red, thick] (P\punktnummer) circle[radius=7mm] node[left]{geht nicht}; }}, ] table[header=true, x expr =0, y expr=0]{ Nr. 3 2 }; \end{axis} % Test \draw[brown] (P0) circle[radius=5mm] node[right]{geht}; \draw[brown] (P1) circle[radius=5mm] node[right]{geht}; \draw[brown] (P1) -- (P3) node[midway, right]{geht auch}; \end{tikzpicture} \end{document} |
|
Du hast Recht, die Koordinaten sind da. Der Grund, warum Du nichts siehst, ist, dass Öffne in Overleaf
\documentclass[margin=5mm, tikz]{standalone} \usetikzlibrary{angles} \usepackage{pgfplots} \usepgfplotslibrary{patchplots} \pgfplotsset{compat=1.13} \begin{document} \begin{tikzpicture} \begin{axis}[hide axis, colormap={Kantenfarbe}{color=(gray) color=(gray)}, ] % Zeichnung der Punkte ===================== \addplot+[nodes near coords=\coordindex, nodes near coords style={%% name=p\coordindex, path picture={% \coordinate[] (P\coordindex) at (p\coordindex.south); },% },%% ] table[header=true, x index=1, y index=2, row sep=\\] { Nr x y \\ 1 1 3 \\%0 2 0 2 \\%1 3 2 2 \\%2 4 2 1 \\%3 }; % Tabellarische Zeichnung von Annotationen ================= \addplot[no marks, nodes near coords={}, % % Versuch ...... visualization depends on={value \thisrowno{0} \as \punktnummer}, nodes near coords style={minimum size=9cm, path picture={ \draw[red, thick] (P\punktnummer) circle[radius=7mm] node[left]{geht nicht}; }}, ] table[header=true, x expr =0, y expr=0]{ Nr. 3 2 }; \end{axis} % Test \draw[brown] (P0) circle[radius=5mm] node[right]{geht}; \draw[brown] (P1) circle[radius=5mm] node[right]{geht}; \draw[brown] (P1) -- (P3) node[midway, right]{geht auch}; \end{tikzpicture} \end{document}
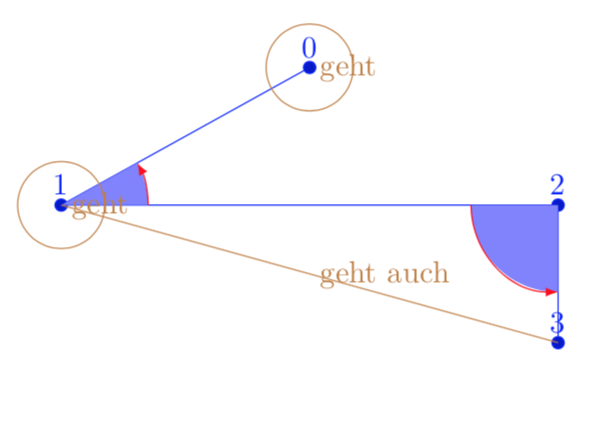
Das Problem ist schon lösbar, zumindest im Prinzip. Das Problem mit Öffne in Overleaf
\documentclass[margin=5mm, tikz]{standalone} \usetikzlibrary{angles,calc} \usepackage{pgfplots} \usepgfplotslibrary{patchplots} \pgfplotsset{compat=1.13} \begin{document} \begin{tikzpicture}[get angle path/.code={\pgfmathtruncatemacro{\ang}{abs(\n2-\n1)} \ifnum\ang>180 \xdef#1{1} \else \xdef#1{0} \fi \typeout{\n1,\n2,\ang}}] \begin{axis}[hide axis, colormap={Kantenfarbe}{color=(gray) color=(gray)}, ] % Zeichnung der Punkte ===================== \addplot+[nodes near coords=\coordindex, nodes near coords style={%% name=p\coordindex, path picture={% \coordinate[] (P\coordindex) at (p\coordindex.south); },% },%% ] table[header=true, x index=1, y index=2, row sep=\\] { Nr x y \\ 1 1 3 \\%0 2 0 2 \\%1 3 2 2 \\%2 4 2 1 \\%3 }; % Tabellarische Zeichnung von Annotationen ================= \addplot[no marks, nodes near coords={}, % % Versuch ...... visualization depends on={value \thisrowno{0} \as \punktnummer}, nodes near coords style={minimum size=15cm,overlay, path picture={%\pgftransformreset % mir ist nicht klar, ob das hilft \pgfmathtruncatemacro{\X}{\punktnummer-1} \pgfmathtruncatemacro{\Y}{\punktnummer+1} \node[anchor=north,red] at (P\Y){\punktnummer}; \path let \p1=($(P\Y)-(P\punktnummer)$),\p2=($(P\X)-(P\punktnummer)$), \n1={atan2(\y1,\x1},\n2={atan2(\y2,\x2} in [get angle path=\mytest]; \ifnum\mytest=0 \draw pic [draw,-latex,red,angle radius=1cm,fill=blue!50] {angle = P\Y--P\punktnummer--P\X}; \else \draw pic [draw,-latex,red,angle radius=1cm,fill=blue!50] {angle = P\X--P\punktnummer--P\Y}; \fi }}, ] table[header=true, x expr =0, y expr=0]{ Nr. 1 2 }; \end{axis} % Test \draw[brown] (P0) circle[radius=5mm] node[right]{geht}; \draw[brown] (P1) circle[radius=5mm] node[right]{geht}; \draw[brown] (P1) -- (P3) node[midway, right]{geht auch}; \end{tikzpicture} \end{document}
Meine Interpretation ist, dass man das nicht so machen soll. Warum auch? Du hast bereits eine Antwort, die die Winkel zeichnet, Und Du musst sowieso irgendwie sagen, welche Winkel Du haben willst, und welche nicht. Warum nicht einfach einen @cis Weil die node zu klein ist. Wenn Du
(10 Sep '18, 19:00)
Community
@cis Es geht schon, fragt sich um welchen Preis. Klar, Du kannst dem möglicherweise Herr werden mit
(10 Sep '18, 20:23)
Community
Wow, dann hast Du es ja jetzt an und für sich gelöst? Ok, es war sehr tiefes TikZ-Wissen nötig, aber ist doch dennoch elegant. Warum ich nicht auf die loop-Lösung setze, liegt daran, dass man teils umfangreiche Tabellen hat, wo man später wieder etwas raussuchen muss. Und man findet eben Sachen leichter in Tabellen als in vielen Schleifen o.ä.
(10 Sep '18, 20:32)
cis
Hast Du vll. noch eine Idee, was man gegen den durch PS: Vertrau mir, dass ist schon gut so mit der Tabelle.....
(10 Sep '18, 21:05)
cis
@cis Mir ist nicht klar, ob ich das "elegant" finden kann. Allerdings habe ich den gröbsten Unfug mal entfernt.
(10 Sep '18, 21:35)
Community
@Murmeltier: Achso einfach 'overlay'. Meine Güte... Ich geb mich geschlagen. :() Also alle Achtung, Du hast wirklich den TikZ-Bogen raus! PS: Ich habe jetzt einfach mal fürs erste PPS: Glaub mir, das ist gut! Das muss so sein mit einer Tabelle, den Standard bekommt jeder hin! ;)
(10 Sep '18, 21:42)
cis
1
@Murmeltier Ich glaube, ich konnte das Problem lösen. Wenn man
und dann den Winkel in
zeichnet, kann man sich dieses Siehe für ein vollst. MWE meine überarbeitete Lösung https://texwelt.de/wissen/fragen/22825/pgfplots-patch-plot-einzeichnung-eines-winkels/22845
(11 Sep '18, 19:10)
cis
@Murmeltier Falls Du den Kommntar nicht lesen konntest: wenn Du willst kannst Du das mit den layern auch mal testen. Bis jetzt konnte ich keine Probleme feststellen, auch bei sehr umfangreichen Beispielen; und die Tabellen-Lösung ist sehr angenehm.
(11 Sep '18, 21:41)
cis
Ergebnis 5 von 8
show 3 more comments
|

Ich denke, dass das Problem ist, dass die Koordinaten schlicht nicht da sind, wenn Du sie brauchst. pgfplots wartet damit bis zum Schluss. Du könntest es mit einer zweiten axis hinbekommen.
Mmhhh, ich versuche es mal. Scheints sind die Koordinaten schon irgendwie da; wenn man z.B.
table[header=true, x expr =0, y expr=0]{
Nr.
55  <---- den Punkt gibt es nicht
2
anwendet, kommt eine Fehlermeldung
no shape P55 is known...Den letzten plot in eine eigene axis-Umgebung zu stecken hat bei mir auch nicht funktioniert.