|
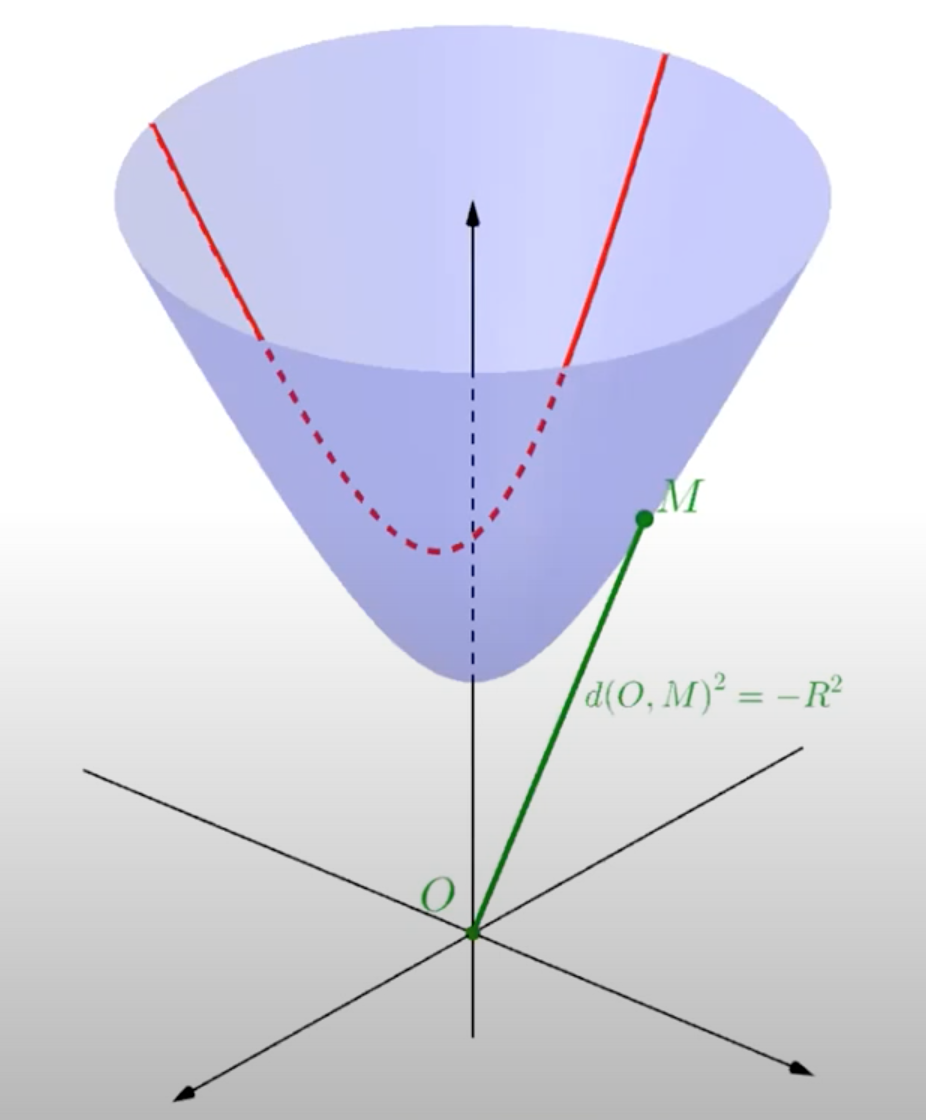
Hallo liebe Community, hoffentlich wird hier mein Beispiellose angezeigt. >.< Ich habe ebenso Schwierigkeiten diese Bild in Tikz umzusetzen:
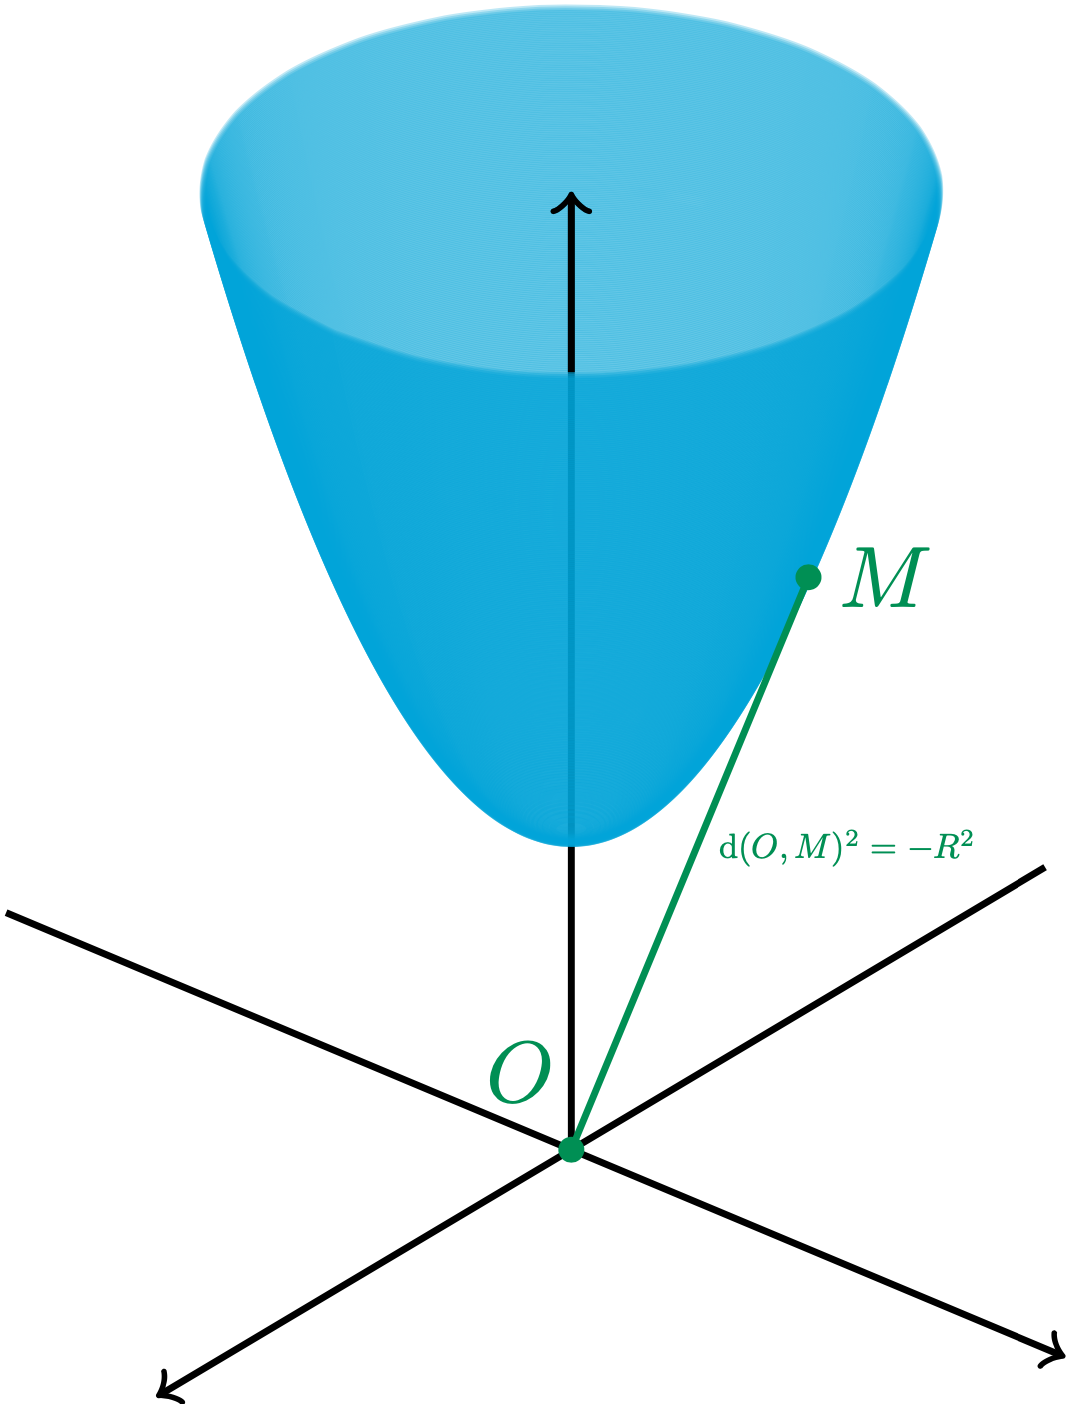
Gerade die Geodäte und die gestrichelten (quasi nicht sichtbaren) Linien bereiten mir Kopfzerbrechen. Hier mein Beispiellose (in der Hoffnung es funktioniert): \documentclass{standalone} % % File name: paraboloid-plane.tex % Description: % A solid bounded by the following surfaces % z = 0 % z = \sqrt{x^{2} + y^{2}} % x^{2} + y^{2} + z^{2} = 1 % is generated. I.e., the intersection of paraboloid and a plane. % % Date of creation: April, 23rd, 2022. % Date of last modification: April, 23rd, 2022. % Author: Efraín Soto Apolinar. % https://www.aprendematematicas.org.mx/author/efrain-soto-apolinar/instructing-courses/ % Terms of use: % According to TikZ.net % https://creativecommons.org/licenses/by-nc-sa/4.0/ % \usepackage[dvipsnames]{xcolor} \usepackage{tikz} \usetikzlibrary{patterns} \usepackage{tikz-3dplot} \usetikzlibrary{math} \usepackage[active,tightpage]{preview} \PreviewEnvironment{tikzpicture} \setlength\PreviewBorder{1pt} \begin{document} \tdplotsetmaincoords{60}{130} \begin{tikzpicture}[tdplot_main_coords,scale=0.75] \tikzmath{function f(\x) {return \x;};} \pgfmathsetmacro{\zini}{0.5*sqrt(2.0)} \pgfmathsetmacro{\step}{0.01} \pgfmathsetmacro{\zsig}{\zini+\step} \pgfmathsetmacro{\nextz}{\zini+0.5*\step} \pgfmathsetmacro{\sig}{2.0*\step} \pgfmathsetmacro{\tini}{0.5*pi} \pgfmathsetmacro{\tfin}{1.85*pi} \pgfmathsetmacro{\tend}{2.5*pi} %%% Coordinate axis \draw[thick,->] (0,0,0) -- (3.5,0,0); \draw[thick] (0,0,0) -- (-4,0,0); \draw[thick,->] (0,0,0) -- (0,3.5,0); \draw[thick] (0,0,0) -- (0,-4,0); \draw[thick,->] (0,0,0) -- (0,0,6.0); % Z axis (part under the plane z = 4) % The region of integration % % The plane: x + y = 2 \coordinate (A) at (2,2,4); \coordinate (B) at (-2,2,4); \coordinate (C) at (-2,-2,4); \coordinate (D) at (2,-2,4); % The paraboloid (level curves z = constant) \foreach \altura in {\step,\sig,...,4.0}{ \pgfmathparse{sqrt(\altura)} \pgfmathsetmacro{\radio}{\pgfmathresult} \draw[cyan,thick,opacity=0.25] plot[domain=0:6.2832,smooth,variable=\t] ({\radio*cos(\t r)},{\radio*sin(\t r)},{\altura+2}); } % \node[ForestGreen,right, scale=0.4] at (1,1.8,3) {$\footnotesize{\mathrm{d}(O,M)^2=-R^2}$}; \draw[thick,->] (0,0,4.87) -- (0,0,6); \draw[ForestGreen, thick] (0,0,0) -- (-2,0,2.7); \coordinate (A) at (0,0,0); \coordinate (B) at (-2,0,2.7); \fill[ForestGreen] (A) circle (2pt); \fill[ForestGreen] (B) circle (2pt); \coordinate(C) at (0,0.1,0.15); \node[ForestGreen, above left] at (C) {$O$}; \node[ForestGreen, right] at (B) {$M$}; \end{tikzpicture} \end{document} Vielleicht habe ich auch hier wieder zu kompliziert gedacht und es geht wesentlich einfacher. Ich bin über jede Hilfe dankbar. |
|
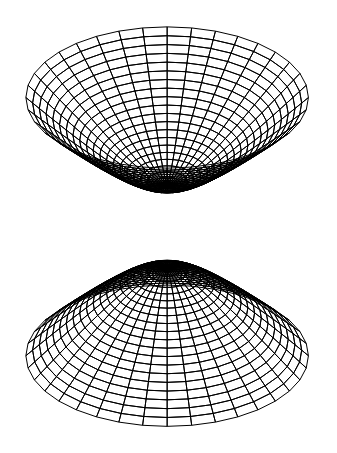
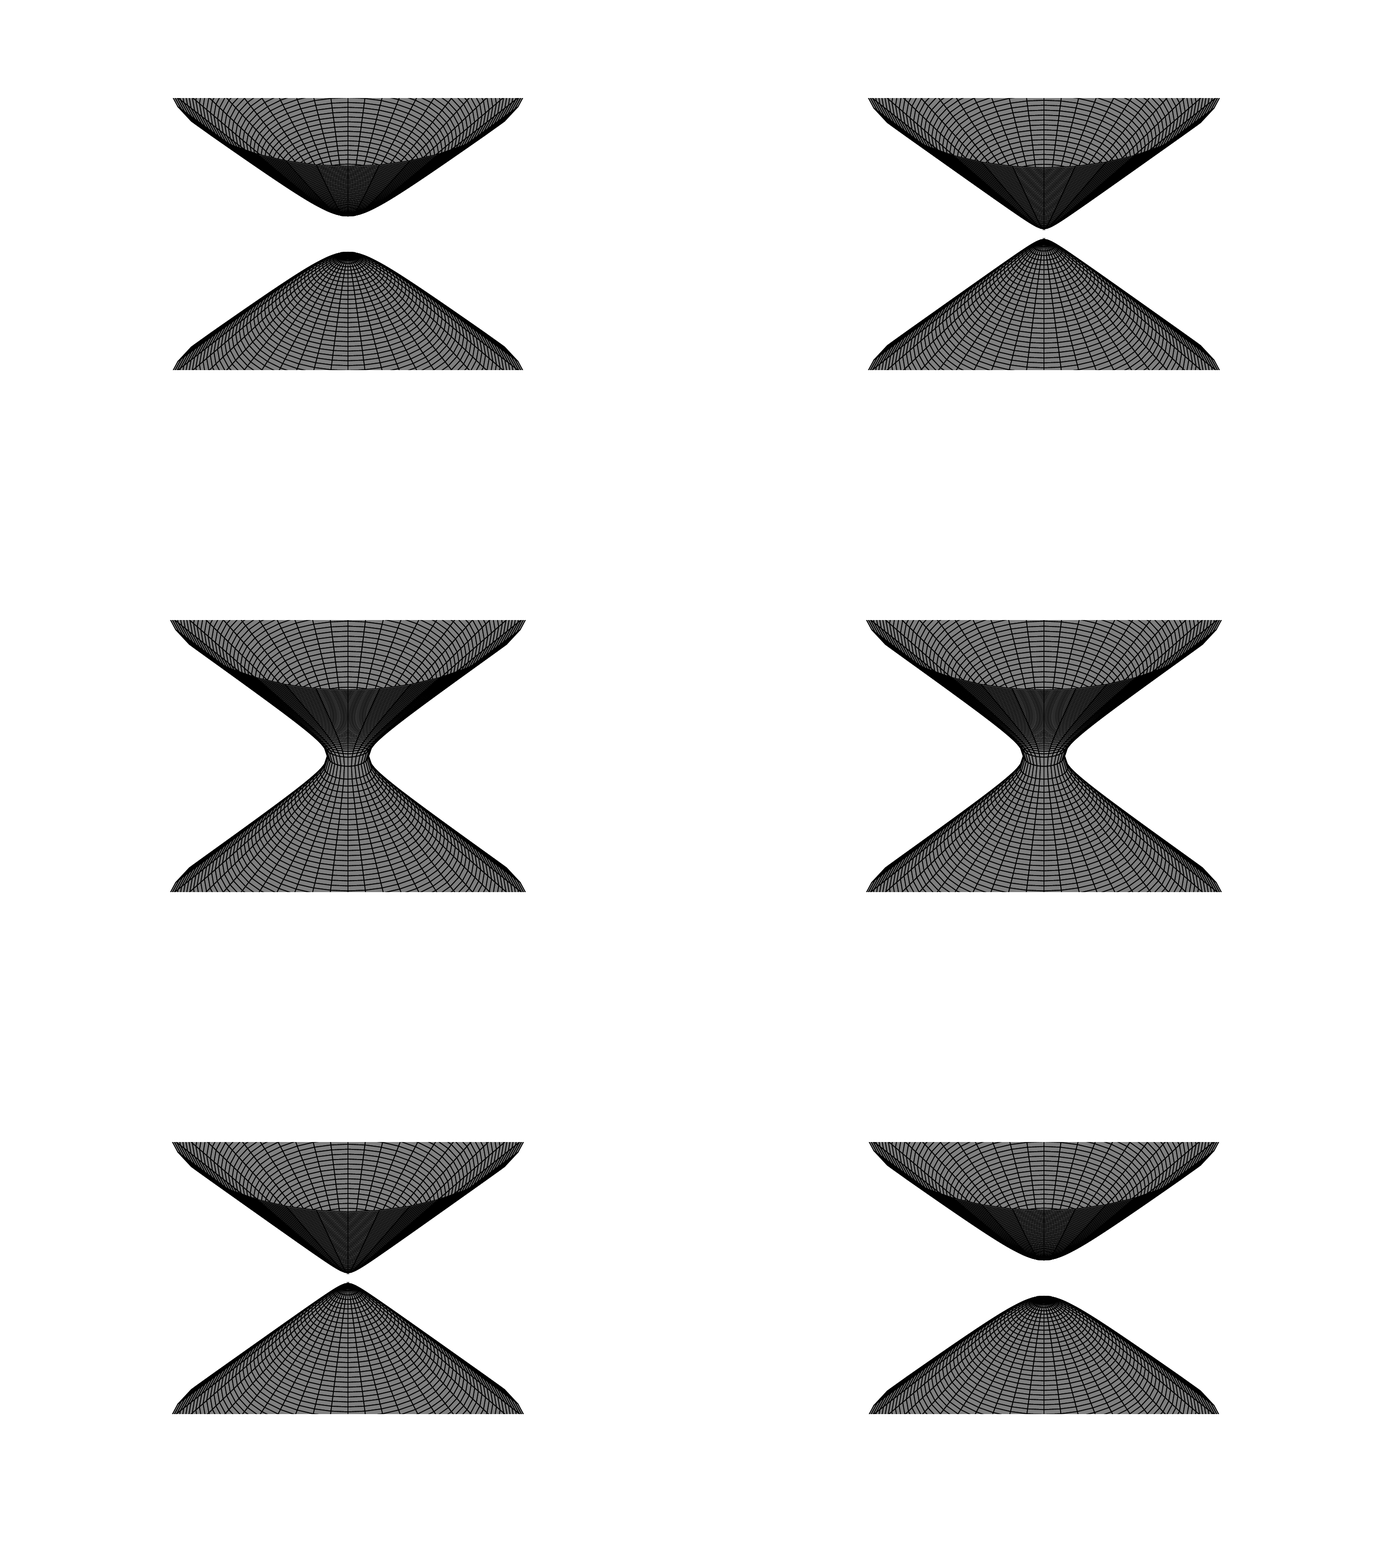
Hinweis: Dies beantwortet die Frage nicht wie geschrieben. Es wird gezeigt, wie man eine parametrisierte Hyperbel perspektivisch in tikz zeichnet - mit Python-Methoden zum Sortieren der Zeichenreihenfolge. Ich weiß nicht, wie eine Geodäte auf einem Hyperboloid aussieht, also weiß ich nicht, wie ich sie zeichnen soll. Ich war in der Lage, diesen parametrisierten Tizz-Code für ein Paraboloid zu schreiben: \documentclass[tikz, border=1cm]{standalone} \usepackage{tikz-3dplot} \newcommand{\polar}{60} \newcommand{\azimuthal}{130} \newcommand{\parameter}{-2} % change this between -5:5 \newcommand{\hyperbola}[1]{ % #1 - the radius of the hyperbola sqrt((#1)^2-(\parameter)+0.001) } \begin{document} \tdplotsetmaincoords{\polar}{\azimuthal} \begin{tikzpicture}[tdplot_main_coords] \ifdim\parameter pt>0pt \foreach[parse=true] \Radius in {(\parameter)^0.5,(\parameter)^0.5+0.2,...,4}{ \foreach \Degrees in {0,10,...,350}{ \draw ({(\Radius)*cos(\Degrees)},{(\Radius)*sin(\Degrees)},{\hyperbola{\Radius}}) -- ({(\Radius)*cos(\Degrees+10)},{(\Radius)*sin(\Degrees+10)},{\hyperbola{\Radius}}) -- ({(\Radius+0.2)*cos(\Degrees+10)},{(\Radius+0.2)*sin(\Degrees+10)},{\hyperbola{\Radius+0.2}}) -- ({(\Radius+0.2)*cos(\Degrees)},{(\Radius+0.2)*sin(\Degrees)},{\hyperbola{\Radius+0.2}}) -- cycle; \draw ({(\Radius)*cos(\Degrees)},{(\Radius)*sin(\Degrees)},{-\hyperbola{\Radius}}) -- ({(\Radius)*cos(\Degrees+10)},{(\Radius)*sin(\Degrees+10)},{-\hyperbola{\Radius}}) -- ({(\Radius+0.2)*cos(\Degrees+10)},{(\Radius+0.2)*sin(\Degrees+10)},{-\hyperbola{\Radius+0.2}}) -- ({(\Radius+0.2)*cos(\Degrees)},{(\Radius+0.2)*sin(\Degrees)},{-\hyperbola{\Radius+0.2}}) -- cycle; } % ends inner foreach } % ends outer foreach \else \foreach[parse=true] \Radius in {0,0.2,...,4}{ \foreach \Degrees in {0,10,...,350}{ \draw ({(\Radius)*cos(\Degrees)},{(\Radius)*sin(\Degrees)},{\hyperbola{\Radius}}) -- ({(\Radius)*cos(\Degrees+10)},{(\Radius)*sin(\Degrees+10)},{\hyperbola{\Radius}}) -- ({(\Radius+0.2)*cos(\Degrees+10)},{(\Radius+0.2)*sin(\Degrees+10)},{\hyperbola{\Radius+0.2}}) -- ({(\Radius+0.2)*cos(\Degrees)},{(\Radius+0.2)*sin(\Degrees)},{\hyperbola{\Radius+0.2}}) -- cycle; \draw ({(\Radius)*cos(\Degrees)},{(\Radius)*sin(\Degrees)},{-\hyperbola{\Radius}}) -- ({(\Radius)*cos(\Degrees+10)},{(\Radius)*sin(\Degrees+10)},{-\hyperbola{\Radius}}) -- ({(\Radius+0.2)*cos(\Degrees+10)},{(\Radius+0.2)*sin(\Degrees+10)},{-\hyperbola{\Radius+0.2}}) -- ({(\Radius+0.2)*cos(\Degrees)},{(\Radius+0.2)*sin(\Degrees)},{-\hyperbola{\Radius+0.2}}) -- cycle; } % ends inner foreach } % ends outer foreach \fi \end{tikzpicture} \end{document} Mit Python war ich in der Lage, jedes der kleinen Rechtecke perspektivisch zu ordnen und zu füllen (ich kenne derzeit keine Möglichkeit, dies in einfachem LaTeX zu tun. (Ich habe den Animationscode weggelassen, da er ein von mir erstelltes Modul verwendet) import math import numpy as np import subprocess polar_angle = 60 azimuthal_angle = 30 def signed_distance(point, plane_point, normal_vector): return np.dot(point - plane_point, normal_vector) / np.linalg.norm(normal_vector) def sphereX(polar: float, azimuthal: float) -> float: return math.cos(math.radians(polar)) * math.cos(math.radians(azimuthal)) def sphereY(polar: float, azimuthal: float) -> float: return math.cos(math.radians(polar)) * math.sin(math.radians(azimuthal)) def sphereZ(polar: float, azimuthal: float) -> float: return math.sin(math.radians(polar)) viewdirX = sphereX(90 - 60, -30) viewdirY = sphereY(90 - 60, -30) viewdirZ = sphereZ(90 - 60, -30) the_normal_vector = np.array([viewdirX, viewdirY, viewdirZ]) def hyperbola(radius: float) -> float: return math.sqrt(radius**2 - 1) def calculate_center(rectangle): return np.mean(rectangle, axis=0) rectangles = [] # Generate rectangles for radius in np.arange(1, 5, 0.2): for angle in range(0, 360, 10): angle_rad = math.radians(angle) angle_next_rad = math.radians(angle + 10) r_coords = [ (radius * math.cos(angle_rad), radius * math.sin(angle_rad), hyperbola(radius)), (radius * math.cos(angle_next_rad), radius * math.sin(angle_next_rad), hyperbola(radius)), ((radius + 0.2) * math.cos(angle_next_rad), (radius + 0.2) * math.sin(angle_next_rad), hyperbola(radius + 0.2)), ((radius + 0.2) * math.cos(angle_rad), (radius + 0.2) * math.sin(angle_rad), hyperbola(radius + 0.2)) ] rectangles.append(r_coords) # Duplicate the rectangle with negative z-values r_coords_negative = [ (x, y, -z) for (x, y, z) in r_coords ] rectangles.append(r_coords_negative) # Sort rectangles based on depth with respect to the normal vector plane_point = np.array([0, 0, 0]) # Define a plane point rectangles.sort(key=lambda rect: signed_distance(calculate_center(rect), plane_point, the_normal_vector)) # Prepare TeX document preamble = f""" \\documentclass[tikz, border=1cm]{{standalone}} \\usepackage{{tikz-3dplot}} \\begin{{document}} \\tdplotsetmaincoords{{{polar_angle}}}{{{azimuthal_angle}}} \\begin{{tikzpicture}}[tdplot_main_coords] """ postscript = f""" \\end{{tikzpicture}} \\end{{document}} """ with open("TeX_File.tex", "w") as TeX: TeX.write(preamble) for rectangle in rectangles: drawn_rectangle = f""" \\fill[white] ({rectangle[0][0]},{rectangle[0][1]},{rectangle[0][2]}) -- ({rectangle[1][0]},{rectangle[1][1]},{rectangle[1][2]}) -- ({rectangle[2][0]},{rectangle[2][1]},{rectangle[2][2]}) -- ({rectangle[3][0]},{rectangle[3][1]},{rectangle[3][2]}) -- cycle; \\fill[opacity=0.5] ({rectangle[0][0]},{rectangle[0][1]},{rectangle[0][2]}) -- ({rectangle[1][0]},{rectangle[1][1]},{rectangle[1][2]}) -- ({rectangle[2][0]},{rectangle[2][1]},{rectangle[2][2]}) -- ({rectangle[3][0]},{rectangle[3][1]},{rectangle[3][2]}) -- cycle; \\draw ({rectangle[0][0]},{rectangle[0][1]},{rectangle[0][2]}) -- ({rectangle[1][0]},{rectangle[1][1]},{rectangle[1][2]}) -- ({rectangle[2][0]},{rectangle[2][1]},{rectangle[2][2]}) -- ({rectangle[3][0]},{rectangle[3][1]},{rectangle[3][2]}) -- cycle; """ TeX.write(drawn_rectangle) TeX.write(postscript) subprocess.run(['lualatex', "TeX_File.tex"]) |


Das sieht doch aus wie ein Paraboloid? Efrains Code auf TikZ.net hat dort eigentlich solche Linien, die Du analog plotten kannst, natürlich ggf. mit Hyperbelformel für 3d-Plot und die Linien.
@stefan ja du hast vollkommen recht, ich habe es nachgetragen! ... Ich habe einiges aus dem Netz probiert und versucht umzumünzen auf mein Problem. Der Unterschied zum Paraboloid ist, dass es durch den Ursprung verläuft. Deswegen habe ich versucht die Achsen zu verschieben, damit man das Hyperboloid besser erkennt. Bei der Geodäte (rote Linie im oberen Bild) bin ich ratlos :/
Ich habe zum Spaß ein parametrisiertes Tikz-Diagramm eines Hyperboloids erstellt, nachdem ich Ihre Frage gesehen hatte. Ich war nicht in der Lage, die Geodäten zu bekommen, weil ich nicht weiß, wie das aussieht, also zögere ich, meine Arbeit zu veröffentlichen. Wenn Sie ein Bild einer Geodäte auf einem Hyperboloid bereitstellen könnten, könnte ich meine Arbeit ausarbeiten und sie postbar machen. (Würde ich Ärger bekommen, wenn ich meine Zwischenarbeit veröffentlichen würde?)
P.S. dies ist aus dem Englischen übersetzt
Hallo @Jasper, poste das gern. Ideen und Inhalte sind wichtiger als formale Regeln.