|
Anlehnend an das Handbuchbeispiel für Die Kanten können bequem in der Form Öffne in Overleaf
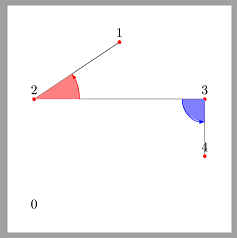
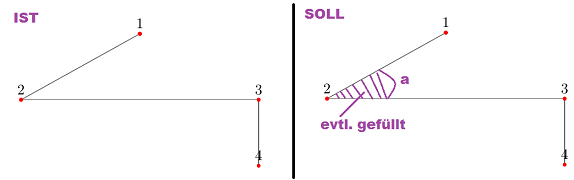
patch table with point meta={%
Startpkt Endpkt colordata \\%colordata weglassen
1 2 \\%
3 2 \\%
...
}
eingegeben werden. Nun möchte ich an manche der Punkte, d.h. zwischen manche der Kanten, einen Winkel einzeichnen. Ich habe mich gefragt, ob das evtl. auch durch einen weiteren patch plot ginge. Besonders elegant wäre also eine Lösung mit einem weiteren patch plot mit Öffne in Overleaf
patch table with point meta={%
Punkt1 Scheitel Punkt2 Winkelname          colordata \\
3 2 1 a        0\\%
...
}
Was dann den eingezeichneten Winkel ' Hat vll. jmd. eine Idee, wie das gehen könnte? MWE: Öffne in Overleaf
\documentclass[margin=5mm, tikz]{standalone} \usepackage{pgfplots} \usepgfplotslibrary{patchplots} \pgfplotsset{compat=1.13} \begin{document} \begin{tikzpicture} \begin{axis}[hide axis, colormap={Kantenfarbe}{color=(gray) color=(gray)}, ] % Zeichnung der Punkte ===================== \addplot+[ mark size=1.125pt, mark options={red}, table/row sep=\\, patch, % Plot-Typ patch type=polygon, vertex count=2, % damit nur Kanten, keine Flächen, gezeichnet werden % % Angabe der Verbindungskanten ===================== patch table with point meta={% Startpkt Endpkt colordata \\%colordata weglassen 1 2 \\% 1 1 \\% 1 2 \\% 2 3 \\ 3 4 \\ } % Tabelle der Punkte ===================== ] table[header=true, x index=1, y index=2, row sep=\\] { Nr x y \\ 0 0 0 \\%0: 0. Aliaspunkt 1 1 3 \\%1 2 0 2 \\%2 3 2 2 \\%3 4 2 1 \\%4 }; % Beschriftungen ============================ \addplot[only marks, %visualization depends on={value \thisrowno{0} \as \punktnummer}, nodes near coords={\coordindex}, ] table[header=true, x index=1, y index=2, row sep=\\] { Nr x y \\ 0 0 0 \\%0: 0. Aliaspunkt 1 1 3 \\%1 2 0 2 \\%2 3 2 2 \\%3 4 2 1 \\%4 }; % Zeichnung der Winkel ===================== %.... \end{axis} \end{tikzpicture} \end{document} |
|
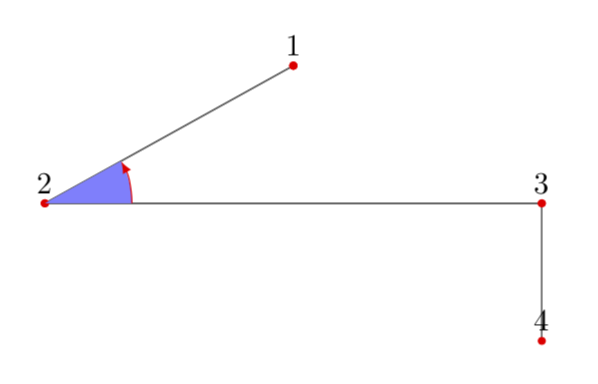
Du musst nur auf die Koordinaten zugreifen, was ich hier mit einem Alias mache, deren südliche Anker entsprechen dann den Punkten aus der Tabelle. Dann kann man mit der Öffne in Overleaf
\documentclass[margin=5mm, tikz]{standalone}
\usetikzlibrary{angles}
\usepackage{pgfplots}
\usepgfplotslibrary{patchplots}
\pgfplotsset{compat=1.13}

\begin{document}

\begin{tikzpicture}
\begin{axis}[hide axis,
colormap={Kantenfarbe}{color=(gray) color=(gray)},
]

% Zeichnung der Punkte =====================
\addplot+[
mark size=1.125pt, mark options={red},
table/row sep=\\,
patch, % Plot-Typ
patch type=polygon,
vertex count=2, % damit nur Kanten, keine Flächen, gezeichnet werden
%
% Angabe der Verbindungskanten =====================
patch table with point meta={%
Startpkt Endpkt colordata \\%colordata weglassen
1 2 \\%
1 1 \\%
1 2 \\%
2 3  \\
3 4  \\
}
% Tabelle der Punkte =====================
]
table[header=true, x index=1, y index=2, row sep=\\] {
Nr x y  \\
0 0 0     \\%0: 0. Aliaspunkt
1 1 3             \\%1
2 0 2              \\%2
3 2 2              \\%3
4 2 1              \\%4
};

% Beschriftungen  ============================
\addplot[only marks,
%visualization depends on={value \thisrowno{0} \as \punktnummer},
nodes near coords={\coordindex},
nodes near coords style={alias=c-\coordindex},
] table[header=true, x index=1, y index=2, row sep=\\] {
Nr x y  \\
0 0 0     \\%0: 0. Aliaspunkt
1 1 3             \\%1
2 0 2              \\%2
3 2 2              \\%3
4 2 1              \\%4
};

% Zeichnung der Winkel =====================
%....

\end{axis}
\path foreach \X in {1,2,3} {(c-\X.south) coordinate (X\X)};
\draw pic [draw,-latex,red,angle radius=1cm,fill=blue!50] {angle = X3--X2--X1};
\end{tikzpicture}
\end{document}
Sehr gut! Daran hatte ich auch zuerst gedacht. Jetzt kommt wieder die Sache mit den teils umfangreichen Datensätzen. Daher hake ich erstmal noch nicht ab; in der Hoffnung, dass ich ggf. noch eine Tabellenlösung als patch plot finde...
(10 Sep '18, 02:33)
cis
Oder spontane Idee: vll. könnte man Deine Lösung dennoch in einem "plot table" verarbeiten mit "nodes neard coord" --> "path picture" oder sowas. Sofern die Koordinaten vorliegen, aus dem Plot der Punkte sollte das gehen. Muss ich mal etwas drüber grübeln.....
(10 Sep '18, 02:37)
cis
@cis Wie Du in Deiner anderen Frage siehst, ist das nicht unbedingt einfach. Das Problem ist, dass pgfplots die Dinge in einer gewissen Reihenfolge ausführt. Das bedeutet, dass Du auf die symbolischen Koordinaten nicht unbedingt zugreifen kannst Wenn Du das willst. Um zu sehen, was das bedeutet, schau Dir z.B. https://tex.stackexchange.com/questions/261577/a-problem-with-pgfplots-and-coordinates an. Wie Du siehst, sind die Koordinaten nicht fertig, wenn man sie haben will. Deswegen habe ich den Winkel nach der
(10 Sep '18, 15:12)
Community
|
|
Mit der Lösung von @Murmeltier im Thread konnte ich folgendes MWE erstellen. (Da das aber als zu umständlich gilt, gebe ich seiner Lösung den Vorzug.)
Öffne in Overleaf
\documentclass[margin=5mm, tikz]{standalone} \usetikzlibrary{angles} %\usetikzlibrary{quotes, babel} \usepackage{pgfplots} \usepgfplotslibrary{patchplots} \pgfplotsset{compat=1.13} % Für die Winkel \pgfdeclarelayer{bg} % declare background layer \pgfsetlayers{bg,main} % set the order of the layers (main is the standard \begin{document} \begin{tikzpicture} \begin{axis}[hide axis, colormap={Kantenfarbe}{color=(gray) color=(gray)}, %width=7cm, height=3cm, ] % Zeichnung der Punkte ===================== \addplot+[ mark size=1.125pt, mark options={red}, table/row sep=\\, patch, % Plot-Typ patch type=polygon, vertex count=2, % damit nur Kanten, keine Flächen, gezeichnet werden % % Angabe der Verbindungskanten ===================== patch table with point meta={% Startpkt Endpkt colordata \\%colordata weglassen 1 2 \\% 1 1 \\% 1 2 \\% 2 3 \\% 3 4 \\% } ] table[header=true, x index=1, y index=2, row sep=\\] { Nr x y \\ 0 0 0 \\%0: 0. Aliaspunkt 1 1 3 \\%1 2 0 2 \\%2 3 2 2 \\%3 4 2 1 \\%4 }; % Beschriftungen ============================ % Anzeigen des 0. Aliaspunktes verhindern: \newcommand\Punktnummer{\pgfmathparse{\punktnummer>0 ? \punktnummer : ""}\pgfmathresult} \addplot[only marks, visualization depends on={value \thisrowno{0} \as \punktnummer}, nodes near coords={\Punktnummer}, % nodes near coords style={ name=p-\punktnummer, %alias=p-\punktnummer, path picture={% Jedem Punkt als Koordinate zuordnen: \coordinate[] (P\punktnummer) at (p-\coordindex.south); },% %inner sep=0pt, outer sep=0pt }, ] table[header=true, x index=1, y index=2, row sep=\\] { Nr x y \\ 0 0 0 \\%0: 0. Aliaspunkt 1 1 3 \\%1 2 0 2 \\%2 3 2 2 \\%3 4 2 1 \\%4 }; % Zeichnung der Winkel ===================== \addplot[no marks, nodes near coords={}, %visualization depends on={value \thisrowno{0} \as \punktnummer}, visualization depends on={value \thisrowno{0} \as \PunktI}, visualization depends on={value \thisrowno{1} \as \Scheitel}, visualization depends on={value \thisrowno{2} \as \PunktII}, visualization depends on={value \thisrowno{3} \as \Winkelradius}, visualization depends on={value \thisrowno{4} \as \Winkelfarbe}, nodes near coords style={% %minimum size=2\textwidth, % 12cm %<- nicht nötig %overlay, %<- nicht nötig path picture={%\pgftransformreset % Winkel zeichnen \begin{pgfonlayer}{bg} % 'select the background layer' für die Winkel \draw pic [angle radius=\Winkelradius, fill=\Winkelfarbe!50, draw=\Winkelfarbe, %<- Winkel färben / zeichnen %-latex, %<- Winkel mit Pfeil %"aaa", angle eccentricity =-3.0 %<- besser weglassen... ] {angle = P\PunktI--P\Scheitel--P\PunktII}; \end{pgfonlayer} }},% ] table[header=true, x expr =0, y expr=0]{ Punkt1 Scheitel Punkt2 Winkelradius Winkelfarbe 3 2 1 1.2cm red 2 3 4 0.6cm blue }; \end{axis} % Test %\draw[red] (P1) -- (P3); % %\draw pic [draw,-,red,angle radius=1cm,fill=red!50] {angle = P3--P2--P1}; % %\draw pic [draw,-,red,angle radius=1cm,fill=red!50] {angle = P2--P3--P4}; \end{tikzpicture} \documentclass[margin=5mm, tikz]{standalone} \usetikzlibrary{angles} %\usetikzlibrary{quotes, babel} \usepackage{pgfplots} \usepgfplotslibrary{patchplots} \pgfplotsset{compat=1.13} % Für die Winkel \pgfdeclarelayer{bg} % declare background layer \pgfsetlayers{bg,main} % set the order of the layers (main is the standard \begin{document} \begin{tikzpicture} \begin{axis}[hide axis, colormap={Kantenfarbe}{color=(gray) color=(gray)}, %width=7cm, height=3cm, ] % Zeichnung der Punkte ===================== \addplot+[ mark size=1.125pt, mark options={red}, table/row sep=\\, patch, % Plot-Typ patch type=polygon, vertex count=2, % damit nur Kanten, keine Flächen, gezeichnet werden % % Angabe der Verbindungskanten ===================== patch table with point meta={% Startpkt Endpkt colordata \\%colordata weglassen 1 2 \\% 1 1 \\% 1 2 \\% 2 3 \\% 3 4 \\% } ] table[header=true, x index=1, y index=2, row sep=\\] { Nr x y \\ 0 0 0 \\%0: 0. Aliaspunkt 1 1 3 \\%1 2 0 2 \\%2 3 2 2 \\%3 4 2 1 \\%4 }; % Beschriftungen ============================ % Anzeigen des 0. Aliaspunktes verhindern: \newcommand\Punktnummer{\pgfmathparse{\punktnummer>0 ? \punktnummer : ""}\pgfmathresult} \addplot[only marks, visualization depends on={value \thisrowno{0} \as \punktnummer}, nodes near coords={\Punktnummer}, % nodes near coords style={ name=p-\punktnummer, %alias=p-\punktnummer, path picture={% Jedem Punkt als Koordinate zuordnen: \coordinate[] (P\punktnummer) at (p-\coordindex.south); },% %inner sep=0pt, outer sep=0pt }, ] table[header=true, x index=1, y index=2, row sep=\\] { Nr x y \\ 0 0 0 \\%0: 0. Aliaspunkt 1 1 3 \\%1 2 0 2 \\%2 3 2 2 \\%3 4 2 1 \\%4 }; % Zeichnung der Winkel ===================== \addplot[no marks, nodes near coords={}, %visualization depends on={value \thisrowno{0} \as \punktnummer}, visualization depends on={value \thisrowno{0} \as \PunktI}, visualization depends on={value \thisrowno{1} \as \Scheitel}, visualization depends on={value \thisrowno{2} \as \PunktII}, visualization depends on={value \thisrowno{3} \as \Winkelradius}, visualization depends on={value \thisrowno{4} \as \Winkelfarbe}, nodes near coords style={% %minimum size=2\textwidth, % 12cm %<- nicht nötig %overlay, %<- nicht nötig path picture={%\pgftransformreset % Winkel zeichnen \begin{pgfonlayer}{bg} % 'select the background layer' für die Winkel \draw pic [angle radius=\Winkelradius, fill=\Winkelfarbe!50, draw=\Winkelfarbe, %<- Winkel färben / zeichnen %-latex, %<- Winkel mit Pfeil %"aaa", angle eccentricity =-3.0 %<- besser weglassen... ] {angle = P\PunktI--P\Scheitel--P\PunktII}; \end{pgfonlayer} }},% ] table[header=true, x expr =0, y expr=0]{ Punkt1 Scheitel Punkt2 Winkelradius Winkelfarbe 3 2 1 1.2cm red 2 3 4 0.6cm blue }; \end{axis} % Test %\draw[red] (P1) -- (P3); % %\draw pic [draw,-,red,angle radius=1cm,fill=red!50] {angle = P3--P2--P1}; % %\draw pic [draw,-,red,angle radius=1cm,fill=red!50] {angle = P2--P3--P4}; \end{tikzpicture} \end{document} Ja, das ist eine sehr schöne Lösung! Einen kleinen Kommentar kann ich mr dennoch nicht verkneifen: aus Deiner Frage oben war mir nicht wirklich klar, wohin die Reise gehen soll. Es wäre evtl. besser, entweder alle Randbedingungen und Seitengedanken zu formulieren, was aber dazu führen kann, dass sich das niemand durchlesen mag, oder aber in kleinen Schritten vorzugehen, d.h. zu jedem Schritt eine klare, wohldefinierte Frage zu stellen. Du kannst dann ja immer noch das Gesamtbild irgendwo anbringen.
(12 Sep '18, 00:24)
Community
|