|
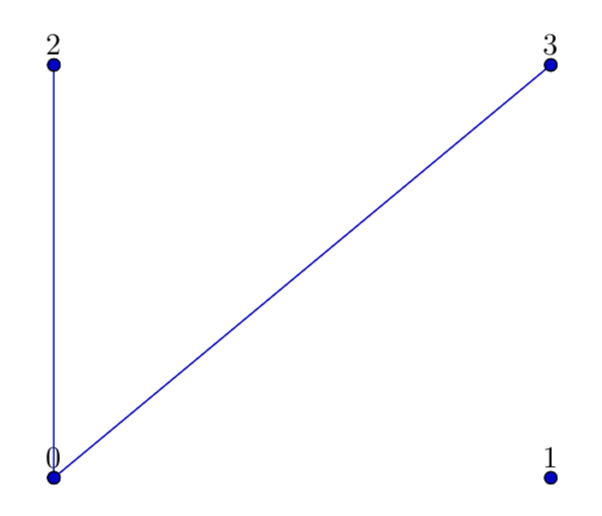
Für eine Koordinatentabelle mit 4 Punkten gebe ich folgende Verbindungen an Öffne in Overleaf
patch table with point meta={
Startpkt Endpkt colordata  \\
0 0 \\
1 1 \\
2 2 \\
3 3  \\% Bis hierhin ok....
0 3 \\% Ab hier wird überschrieben
0 2  \\
},
Gehen dabei von einem Punkt mehrere Kanten aus, wird mehrmals eine "Punktnummer" gesetzt durch Öffne in Overleaf
visualization depends on={value \thisrowno{0} \as \punktnummer},
nodes near coords={\punktnummer}
Mit Hilfe dieses Miniprogrammes kann ich mehrfache Elemente aus Liste ausschließen. Aber ich weiß nicht wie ich das bei nodes near coords reinbastle. BTW: Falls jmd. ein solches Listenprüfprogramm mit
Öffne in Overleaf
\documentclass[margin=5mm]{standalone}
\usepackage{tikz, pgffor, amsmath, amssymb}
\begin{document}

\foreach \t in {1,2,3,...,10}{% natürliche Zahlenfolge
% \pgfmathsetmacro{\u}{0}
\foreach \x in {1,2,2,3,4,5,7}{% zu testende Zahlen
    \ifx \x\t%
    \global\let\u=\t%
    \fi%
}%
\ifx \u\t%
{\t~}%
\else{}% Leer
\fi%
}
\end{document}
Minimalbeispiel:
Öffne in Overleaf
\documentclass[margin=5mm, tikz]{standalone} \usepackage{pgfplots} \usepgfplotslibrary{patchplots} \pgfplotsset{compat=1.13} \begin{document} \begin{tikzpicture} \begin{axis}[hide axis] \addplot+[ table/row sep=newline, patch, % Plot-Typ patch type=polygon, vertex count=2, % damit nur Kanten, keine Flächen, gezeichnet werden % % Angabe der Verbindungskanten ===================== patch table with point meta={ Startpkt Endpkt colordata \\ 0 0 \\ 1 1 \\ 2 2 \\ 3 3 \\% Bis hierhin ok.... 0 3 \\% Ab hier wird überschrieben 0 2 \\ }, % % Beschriftung visualization depends on={value \thisrowno{0} \as \punktnummer}, nodes near coords={\punktnummer} ] % Koordinatentabelle table[header=true, x index=1, y index=2, row sep=\\] { Nr x y \\ 0 0 0 \\ 1 1 0 \\ 2 0 1 \\ 3 1 1 \\ }; \end{axis} \end{tikzpicture} \end{document} |

|
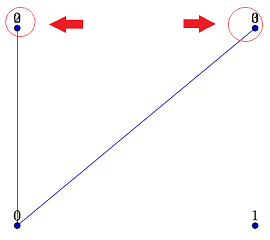
Es gibt da vermutlich viele Möglichkeiten, die einfachste ist vermutlich, dass Du die Punkte in einer separaten Tabelle labelst. Aber weil Du das vermutlich schon weisst und nicht magst, hier kommt eine andere Möglichkeit, die die Duplikate einfach ausblendet. Wer weiss, vielleicht ist das am Ende sogar noch für irgendwas gut. ;-) Öffne in Overleaf
\documentclass[margin=5mm, tikz]{standalone}
\usepackage{pgfplots}
\usepgfplotslibrary{patchplots}
\pgfplotsset{compat=1.13}
\xdef\LstPN{-1}
\newif\ifDupe
\pgfplotsset{avoid dupes/.code={\Dupefalse
\foreach \X in \LstPN
{\pgfmathtruncatemacro{\itest}{ifthenelse(\X==\punktnummer,1,0)}
\ifnum\itest=1
\global\Dupetrue
\breakforeach
\fi}
\ifDupe
\typeout{\punktnummer\space ist\space ein\space Duplikat!}
\pgfkeysalso{/tikz/opacity=0} %macht die Nummer einfach unsichtbar
\else
\xdef\LstPN{\LstPN,\punktnummer}
\fi}}
\begin{document}

\begin{tikzpicture}
\begin{axis}[hide axis]
\addplot+[
table/row sep=newline,
patch, % Plot-Typ
patch type=polygon,
vertex count=2, % damit nur Kanten, keine Flächen, gezeichnet werden
%
% Angabe der Verbindungskanten =====================
patch table with point meta={
Startpkt Endpkt colordata  \\
0 0 \\
1 1 \\
2 2 \\
3 3  \\% Bis hierhin ok....
0 3 \\% Ab hier wird überschrieben
0 2  \\
},
%
% Beschriftung
visualization depends on={value \thisrowno{0} \as \punktnummer},
every node near coord/.append style={
            /pgfplots/avoid dupes
        },
nodes near coords={\punktnummer}
]
% Koordinatentabelle
table[header=true, x index=1, y index=2, row sep=\\] {
Nr x y  \\
0 0 0     \\
1 1 0             \\
2 0 1              \\
3 1 1              \\
};
\end{axis}
\end{tikzpicture}
\end{document}
Du kannst die redundanten Punktnummern auch einfach killen. Öffne in Overleaf
\documentclass[margin=5mm, tikz]{standalone} \usepackage{pgfplots} \usepgfplotslibrary{patchplots} \pgfplotsset{compat=1.13} \xdef\LstPN{-1} \newif\ifDupe \pgfplotsset{avoid dupes/.code={\Dupefalse \foreach \X in \LstPN {\pgfmathtruncatemacro{\itest}{ifthenelse(\X==\punktnummer,1,0)} \ifnum\itest=1 \global\Dupetrue \breakforeach \fi} \ifDupe \typeout{\punktnummer\space ist\space ein\space Duplikat!} \xdef\punktnummer{} %macht die Nummer einfach unsichtbar \else \xdef\LstPN{\LstPN,\punktnummer} \fi}} \begin{document} \begin{tikzpicture} \begin{axis}[hide axis] \addplot+[ table/row sep=newline, patch, % Plot-Typ patch type=polygon, vertex count=2, % damit nur Kanten, keine Flächen, gezeichnet werden % % Angabe der Verbindungskanten ===================== patch table with point meta={ Startpkt Endpkt colordata \\ 0 0 \\ 1 1 \\ 2 2 \\ 3 3 \\% Bis hierhin ok.... 0 3 \\% Ab hier wird überschrieben 0 2 \\ }, % % Beschriftung visualization depends on={value \thisrowno{0} \as \punktnummer}, every node near coord/.append style={ /pgfplots/avoid dupes }, nodes near coords={\punktnummer} ] % Koordinatentabelle table[header=true, x index=1, y index=2, row sep=\\] { Nr x y \\ 0 0 0 \\ 1 1 0 \\ 2 0 1 \\ 3 1 1 \\ }; \end{axis} \end{tikzpicture} \end{document} Ach Du lieber Himmel. :() Jetzt, erstmal alles verstehen... ;)
(17 Sep '18, 10:03)
cis
Ja, nicht schlecht. Ich bin mir aber ziemlich sicher, dass es auch einfacher / elementarer geht, d.h. nicht geschummelt als style, sondern als echte Platzierungsregel. Normalerweise kann man schon in den labels rumrechnen (ich finde gerade nur das andeutende Bsp. https://texwelt.de/wissen/fragen/22087/pgfplots-trigonometrische-kurve-wie-kann-ich-die-x-achse-mit-beliebigen-pi-faktoren-automatisch-skalieren ). opacity kann auch tückisch sein; etwa bei Hintergründen oder in Voransichten funkt. das gerne nicht.
(17 Sep '18, 12:19)
cis
Bloß sind irgendwie meine Schleifen mistig.
(17 Sep '18, 12:19)
cis
Also ich verstehe das nicht. Das liefert mir "Punktnummer Stück" den Buchstaben a. Das müsste doch jetzt möglich sein, nur die "Stückzahl anzuzeigen"...
(17 Sep '18, 19:04)
cis
@cis Wie gesagt, das einfachste ist, die Nummern einfach mit einem separaten Plot zu platzieren. Und ich sehe nicht, wie
(17 Sep '18, 19:25)
Community
Separater plot verdoppelt grob den Code-Umfang, da zweimal die gleiche Tabelle benötigt wird (schlimm bei Tabellen mit tausend Einträgen). Ach Mann, das muss doch irgendwie gehen, mit der Schleifenmethode - bin nur zu blöd zum Programmieren...
(17 Sep '18, 19:36)
cis
1
@cis Ich habe eine zweite Variante eingebaut, in der ich die Punktnummer einfach kille.
(17 Sep '18, 19:43)
Community
Killen, das entspricht schon eher ganz meinem Gusto. Ich denke, diese Methode werde ich dann verwenden (wobei mir schon das nächste Problem klar ist: die Textpositionierung
(17 Sep '18, 19:52)
cis
1
@cis Aber ich mache doch auch eine Schleife. In Deinem Vorschlag ist halt leider
(17 Sep '18, 19:56)
Community
Ergebnis 5 von 9
show 4 more comments
|