
|
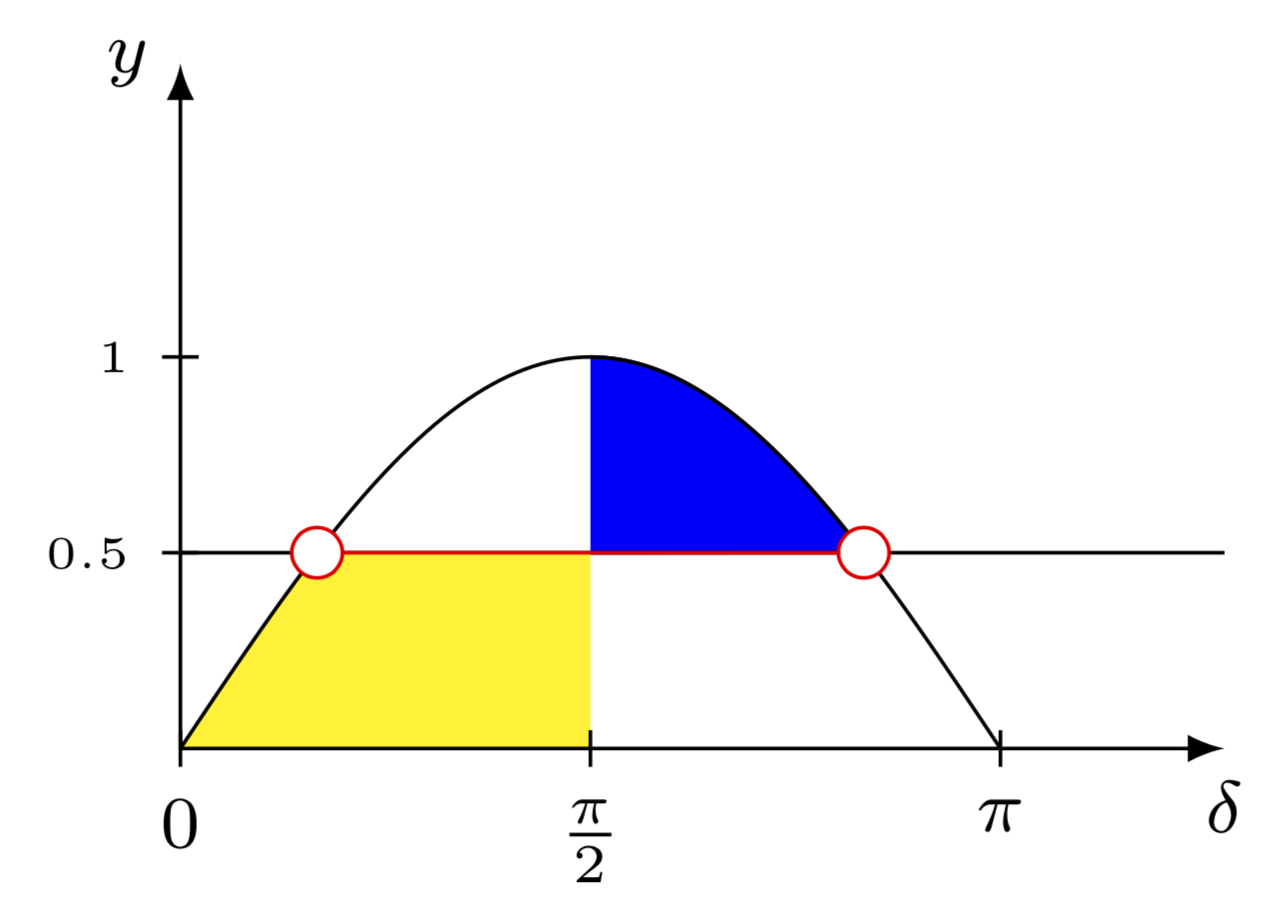
Hallo zusammen ich versuche gerade einen sinus zu zeichnen, welcher zwei Schnittpunkte mit einer Geraden hat. Oberhalb und unterhalb sollen die Flächen eingefärbt werden. Dies funktioniert noch nicht, siehe Code. Unterhalb die Fläche soll von 0 bis pi/2 auf der x Achse eingefärbt werden und oberhalb von pi/2 bis zum zweiten Schnittpunkt. Öffne in Overleaf
\documentclass[varwidth, margin=2.5pt]{standalone} \usepackage[ngerman]{babel} \usepackage{tikz} \usetikzlibrary{plotmarks,calc,arrows} \usepackage{amsmath, amssymb} \begin{document} \def\a{0.5} \begin{tikzpicture}[x = 1cm, y=1.5cm, % scale=0.45, font=\footnotesize, >=latex %Voreinstellung für Pfeilspitzen ] % % Funktionen y = sin(x), y = a \draw[] plot[samples=300, domain=0:3.14159265359] (\x,{sin(\x r)}) node[above=15pt] {}; % Pm \draw[] (4,\a) -- (0,\a) node[above, xshift=5mm] {}; %Schnittpunkte \foreach \k in {0,...,1}{%% % x-Wert berechnen und abspeichern \pgfmathparse{((-1)^\k) * 3.14159265359*asin(\a)/180 + \k*3.14159265359} \let\myresult\pgfmathresult \pgfmathparse{\myresult} \let\myresult\pgfmathresult \draw[color=red, fill=white] plot[mark=*,mark size=2.75pt] coordinates{ ( {\myresult}, {\a} ) }; % \node[] at (\myresult,\a) {\myresult}; }%% % Koordinatensystem % x-Achse \draw[->] (0,0) -- (4,0) node[below] {$\delta$}; %Zahlen auf x-Achse \foreach \x/\xtext in { 0, .5*pi/\frac{\pi}{2}, pi/\pi } \draw (\x,2pt) -- (\x,-2pt) node[below] {$\xtext$}; % y-Achse \draw[->] (0,0) -- (0,1.75) node[left] {$y$}; %Zahlen auf y-Achse \foreach \y in {0.5,1} \draw[] (2pt,\y) -- (-2pt,\y) node[left] {\tiny $\y$}; %Ursprung %\draw[] (0pt,-5pt) node[below right] {$0$}; \shade[top color=blue,bottom color=gray!50] (0,0) parabola (0.52359,0.5) |- (0,0); \end{tikzpicture} \end{document} |
|
Es gibt viele Möglichkeiten, die Flächen zu füllen, hier ist eine davon. Ein wesentlicher Punkt ist, dass der TikZ Parser wesentlich mehr kann als Du anzunehmen scheinst. Damit ist gemeint, dass Du keine komplizierten Ausdrücke wie Öffne in Overleaf
\pgfmathparse{((-1)^\k) * 3.14159265359*asin(\a)/180 + \k*3.14159265359}
\let\myresult\pgfmathresult
\pgfmathparse{\myresult}
\let\myresult\pgfmathresult
brauchst, Du kannst die Ausdrücke direkt in die Koordinaten schreiben. Und Öffne in Overleaf
\documentclass[varwidth, margin=2.5pt]{standalone}
\usepackage{tikz}
\usetikzlibrary{plotmarks}
\begin{document}

\def\a{0.5}
\begin{tikzpicture}[x = 1cm, y=1.5cm, % scale=0.45,
font=\footnotesize,
>=latex   %Voreinstellung für Pfeilspitzen
]
  %
  % Funktionen     y = sin(x),  y = a
  % Pm
  \draw[] (4,\a) -- (0,\a);

  \draw[fill=blue] plot[samples=101, domain={pi/2}:{pi-pi*asin(\a)/180}]
  (\x,{sin(\x r)}) -- (pi/2,1/2);
  \fill[yellow]
  plot[samples=101, domain=0:{pi*asin(\a)/180}]
  (\x,{sin(\x r)}) -- (pi/2,1/2) --(pi/2,0);
  %plot[samples=101, domain={pi-pi*asin(\a)/180}:pi] (\x,{sin(\x r)});
  \draw plot[samples=101, domain=0:pi] (\x,{sin(\x r)});
  %Schnittpunkte
  \draw[color=red, fill=white] plot[mark=*,mark size=2.75pt,variable=\k,samples
  at={0,1}]  ({((-1)^\k) *pi*asin(\a)/180 + \k*pi},  {\a} ) ;

  % Koordinatensystem
  % x-Achse
  \draw[->] (0,0) -- (4,0) node[below] {$\delta$};
  %Zahlen auf x-Achse
  \foreach \x/\xtext in {
      0, .5*pi/\frac{\pi}{2}, pi/\pi
  }
  \draw (\x,2pt) -- (\x,-2pt) node[below] {$\xtext$};

  % y-Achse
  \draw[->] (0,0) -- (0,1.75) node[left] {$y$};
  %Zahlen auf y-Achse
  \foreach \y in {0.5,1}
  \draw[] (2pt,\y) -- (-2pt,\y) node[left,font=\tiny] {$\y$};
\end{tikzpicture}
\end{document}
@saputello Danke für den Kommentar. Aber leider macht die Phrase "Unterhalb die Fläche soll von 0 bis pi/2 auf der x Achse eingefärbt werden" für mich logisch/grammatikalisch keinen Sinn. Deswegen warte ich, bis mir Strompädagoge Feedback gibt.
(04 Feb '19, 18:33)
Community
@Murmeltier Vielen Dank. Das sieht schon super aus. Ich habe die letzten Tage Informationen zu TikZ Parser gesucht, aber leider keine gefunden. Was kann de denn sonst noch? Ich meine mit dem zitierten Satz von @saputello dass die gelbe Fläche nur bis pi/2 reichen soll und danach weiß sein soll. Ab diesem Punkt soll dann erst die blaue Fläche beginnen. Wo kann ich in deinem Code die Grenzen der einzelnen Farben einstellen? Beste Grüße und nocheinmal vielen Dank
(05 Feb '19, 13:09)
Strompädagoge
@Strompädagoge Ist es jetzt besser? (Im Zweifelsfall bietet sich an, einen Skizze zu machen, in der man die Regionen kennzeichnet, oder aber Mathematik zu verwenden, etwa "Die Fläche unter der Kurve mit x<pi/2 und y<1/2." oder so was in der Art.)
(05 Feb '19, 17:06)
Community
@Murmeltier Super genau das war der Plan. Ich bin begeistert.
(06 Feb '19, 09:17)
Strompädagoge
1
@Strompädagoge Dein Kommentar klingt so, als könne er prima durch einen Klick auf den Haken ausgedrückt werden.
(06 Feb '19, 10:24)
saputello
|
|
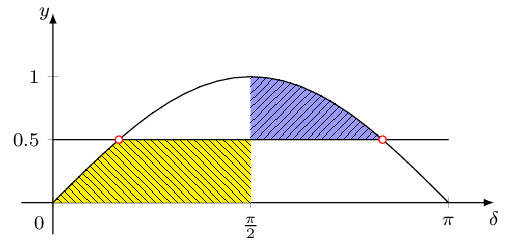
Ich würde mit
Beispiel aus Startpost:
Öffne in Overleaf
\documentclass[border=2pt, varwidth]{standalone} \usepackage{pgfplots} \pgfplotsset{compat=newest} \usetikzlibrary{intersections} \usepgfplotslibrary{fillbetween} \usetikzlibrary{patterns} \begin{document} \begin{tikzpicture}[scale=1, font=\footnotesize, declare function={ Kurve(\x) = sin(\x); Waagrechte(\x) = 0.5; }, ] \newcommand*{\ShowIntersection}[3][]{ \path[name intersections={of=#2 and #3, name=Schnitt, total=\t}, draw=red, fill=white, #1] \ifnum\t>0 \foreach \s in {1,...,\t}{ (Schnitt-\s) circle (1.5pt) } \fi; } \begin{axis}[ trig format plots=rad, axis lines = middle, unit vector ratio*=1 1 1, %axis = equal, axis line style = {-latex}, xmin=-0.25, xmax=3.5, xtick={pi/2, pi}, xticklabels={$\frac{\pi}{2}$, $\pi$, }, extra x ticks = {0}, extra x tick labels= {$0$}, extra x tick style={tick label style={anchor=north east} }, % ytick={0,0.5,...,1}, %samples= 200, ymin = -0.25, ymax=1.5, %enlarge x limits={abs=0.5,upper}, %enlarge y limits={rel=0.5}, % xlabel={$\delta$}, xlabel style={anchor=north}, ylabel={$y$}, ylabel style={anchor=east, inner sep=1pt}, ] \addplot[domain=0:pi, name path=kurve] {Kurve(x)}; \addplot[domain=0:pi, name path=waagrechte] {Waagrechte(x)}; \addplot[draw=none, name path=senkrechte] coordinates {(pi/2, 0) (pi/2, 1.5)}; \ShowIntersection{kurve}{waagrechte} %\ShowIntersection[fill=red]{kurve}{senkrechte} % Links füllen \addplot fill between[of=senkrechte and kurve, split, every segment no 0/.style={fill=yellow, postaction={pattern=north west lines}}, every segment no 1/.style={fill=none}, ]; \addplot fill between[of=waagrechte and kurve, split, every segment no 0/.style={fill=none}, every segment no 1/.style={fill=white}, every segment no 2/.style={fill=none} ]; % Rechts füllen \addplot[domain=pi/2:pi, draw=none, name path=kurveR] {Kurve(x)}; \addplot[domain=pi/2:pi, draw=none, name path=waagrechteR] {Waagrechte(x)}; \addplot fill between[of=kurveR and waagrechteR, split, every segment no 0/.style={fill=blue!40, postaction={pattern=north east lines, solid}}, % "solid" unverständlicherweise nötig every segment no 1/.style={fill=none}, ]; \end{axis} \end{tikzpicture} \end{document} |

Wenn Du den Pfaden Namen gibst und einen unsichtbaren Pfad für die Senkrechte bei pi/2 einfügst, sollte das genau wie bei »Wie kann ich die Fläche zwischen mehreren Pfaden füllen?« funktionieren. Oder gibt es damit ein konkretes Problem?