
|
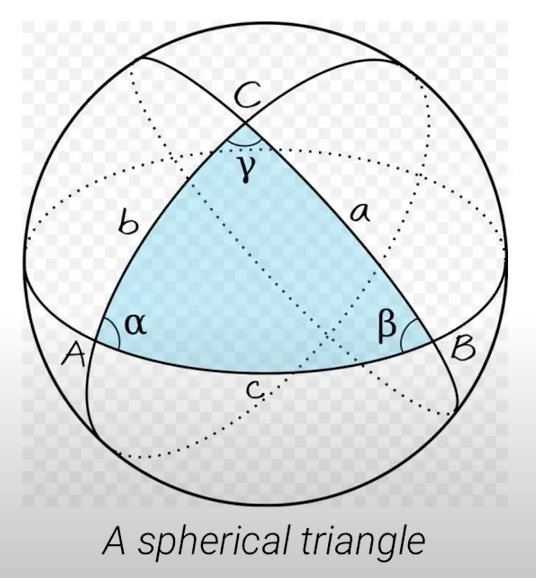
Hallo liebe Community, ich habe mich daran versucht dieses Bild in Ticks zu zeichnen.
Was mir einfach nicht gelingen will ist die Fläche zu Färben. Der karierte Hintergrund ist mir nicht wichtig, aber ich muss irgendwie kennzeichnen, dass alle drei Winkel rechte Winkel sind. Hier mein Codebeispiel bis zum jetzigen Stand. Vielleicht hat jemand eine smartere Idee, weil ich bestimmt zu verkauft herangehe. \documentclass {standalone} \usepackage {tikz} \usetikzlibrary{3d} \usetikzlibrary{calc} \usetikzlibrary{math} \usetikzlibrary{calc,patterns,angles,quotes} \usepackage{tkz-euclide} % isometric axes \pgfmathsetmacro\xx{1/sqrt(2)} \pgfmathsetmacro\xy{1/sqrt(6)} \pgfmathsetmacro\zy{sqrt(2/3)} % some functions (cross products) \tikzmath% {% function crossx(\mx,\my,\mz,\nx,\ny,\nz) {% cross product, x coordinate, normailized \pxx = \my*\nz-\mz*\ny; \pyy = \mz*\nx-\mx*\nz; \pzz = \mx*\ny-\my*\nx; return {\pxx/sqrt(\pxx*\pxx+\pyy*\pyy+\pzz*\pzz)}; }; function crossy(\mx,\my,\mz,\nx,\ny,\nz) {% cross product, y coordinate, normailized \pxx = \my*\nz-\mz*\ny; \pyy = \mz*\nx-\mx*\nz; \pzz = \mx*\ny-\my*\nx; return {\pyy/sqrt(\pxx*\pxx+\pyy*\pyy+\pzz*\pzz)}; }; function crossz(\mx,\my,\mz,\nx,\ny,\nz) {% cross product, z coordinate, normailized \pxx = \my*\nz-\mz*\ny; \pyy = \mz*\nx-\mx*\nz; \pzz = \mx*\ny-\my*\nx; return {\pzz/sqrt(\pxx*\pxx+\pyy*\pyy+\pzz*\pzz)}; }; } \newcommand{\greatcircle}[6] % pole x, y, z, color, two orientation factors (+1/-1) {% \coordinate (P) at (#1,#2,#3); % pole \coordinate (N) at ($(0,0,0)!#6*1.25cm!(P)$); % these points are \coordinate (S) at ($-1*(N)$); % used to clip the \coordinate (E) at ($(0,0,0)!-1.25cm!270:(P)$); % ellipses \coordinate (W) at ($-1*(E)$); % ... \coordinate (NW) at ($(N)+(W)$); \coordinate (NE) at ($(N)+(E)$); \coordinate (SW) at ($(S)+(W)$); \coordinate (SE) at ($(S)+(E)$); \pgfmathsetmacro\ptheta{atan(#2/#1)} % pole, spherical coordinate theta \pgfmathsetmacro\pphi {#5*acos(#3)} % pole, spherical coordinate phi \begin{scope} \clip (W) -- (SW) -- (SE) -- (E) -- cycle; \draw[rotate around z=\ptheta,rotate around y=\pphi,% canvas is xy plane at z=0,#4] (0,0) circle (1); \end{scope} \begin{scope} \clip (W) -- (NW) -- (NE) -- (E) -- cycle; \draw[rotate around z=\ptheta,rotate around y=\pphi,% canvas is xy plane at z=0,#4,densely dotted] (0,0) circle (1); \end{scope} } \begin{document} \begin{tikzpicture}[line cap=round,line join=round,scale=2,% x={({-\xx cm,-\xy cm})},y={(\xx cm,-\xy cm)},z={(0 cm,\zy cm)}] % points A, B, C in spherical coordinates \def\atheta{55} \def\aphi {30} \def\btheta{10} \def\bphi {85} \def\ctheta{70} \def\cphi {80} % points A, B, C in cartesian coordinates \pgfmathsetmacro\ax{cos(\atheta)*sin(\aphi)} \pgfmathsetmacro\ay{sin(\atheta)*sin(\aphi)} \pgfmathsetmacro\az{cos(\aphi)}); \pgfmathsetmacro\bx{cos(\btheta)*sin(\bphi)} \pgfmathsetmacro\by{sin(\btheta)*sin(\bphi)} \pgfmathsetmacro\bz{cos(\bphi)}); \pgfmathsetmacro\cx{cos(\ctheta)*sin(\cphi)} \pgfmathsetmacro\cy{sin(\ctheta)*sin(\cphi)} \pgfmathsetmacro\cz{cos(\cphi)}); % polar points P, Q, R in cartesian coordinates \pgfmathsetmacro\px{crossx(\ax,\ay,\az,\bx,\by,\bz)} \pgfmathsetmacro\py{crossy(\ax,\ay,\az,\bx,\by,\bz)} \pgfmathsetmacro\pz{crossz(\ax,\ay,\az,\bx,\by,\bz)} \pgfmathsetmacro\qx{crossx(\cx,\cy,\cz,\ax,\ay,\az)} \pgfmathsetmacro\qy{crossy(\cx,\cy,\cz,\ax,\ay,\az)} \pgfmathsetmacro\qz{crossz(\cx,\cy,\cz,\ax,\ay,\az)} \pgfmathsetmacro\rx{crossx(\bx,\by,\bz,\cx,\cy,\cz)} \pgfmathsetmacro\ry{crossy(\bx,\by,\bz,\cx,\cy,\cz)} \pgfmathsetmacro\rz{crossz(\bx,\by,\bz,\cx,\cy,\cz)} % triangles \greatcircle{\px}{\py}{\pz}{black}{-1}{1} \greatcircle{\qx}{\qy}{\qz}{black}{ 1}{1} \greatcircle{\rx}{\ry}{\rz}{black}{-1}{1} % sphere and axes \draw (0,0,0) circle (1 cm); \coordinate (A) at (\ax,\ay,\az); \coordinate (B) at (\bx,\by,\bz); \coordinate (C) at (\cx,\cy,\cz); \node[above] at (0.5,1,0.7) {$a$}; \node[above] at (0.5,0,0.2) {$b$}; \node[above] at (0.5,0.4,-0.3) {$c$}; \pic [draw, "$\alpha$", angle eccentricity=1.5, radius=0.3cm] {angle = C--B--A}; \pic [draw, "$\beta$", angle eccentricity=1.5] {angle = A--C--B}; \pic [draw, "$\gamma$", angle eccentricity=1.5] {angle = B--A--C}; \filldraw[fill=blue,fill opacity=0.5](A)--(B)--(C)--cycle; % points \fill[black] (\ax,\ay,\az) circle (0.5pt) node [above] {$C$}; \fill[black] (\bx,\by,\bz) circle (0.5pt) node [below] {$A$}; \fill[black] (\cx,\cy,\cz) circle (0.5pt) node [below left] {$B$}; \end{tikzpicture} \end{document} Vielen Dank schon einmal im Voraus für jeden Rat der mir weiterhilft. EDIT: Hier das was mir ausgegeben wurde:
|
|
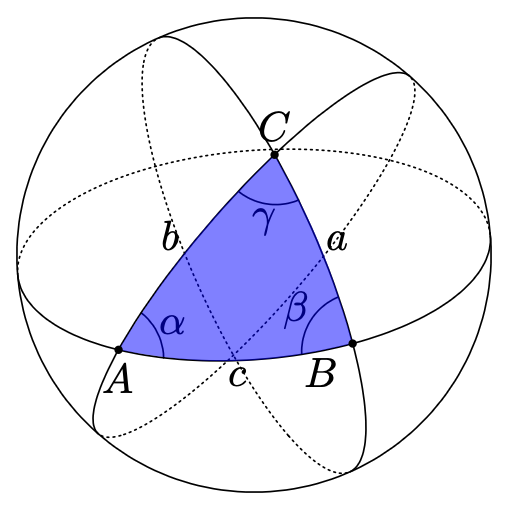
Mit intersections und clipping und z.B. dem spath3-Paket kann man sowas hinkriegen, das sieht mir aber ziemlich schwierig aus. Daher ein einfacher Vorschlag für ein gleich aussehendes Ergebnis - einfach die Dreiecks-Seiten (in Zeile 111) etwas biegen, bis es gut aussieht: \fill[fill=blue, fill opacity=0.5](A) to[bend right=7] (B) to[bend right=12](C) to[bend right=7] (A); Und wenn wir schonmal beim manuellen Justieren sind, nicht-mathematisch aber visuell gut: die Winkel kann man ein bisschen schieben, bis es passend aussieht: \pic [draw, "$\alpha$", angle eccentricity=1.3, transform canvas={shift={(-1.2mm,-0.8mm)}}] {angle = C--B--A}; \pic [draw, "$\beta$", angle eccentricity=1.3, transform canvas={shift={(0.7mm,-0.7mm)}}] {angle = A--C--B}; \pic [draw, "$\gamma$", angle eccentricity=1.3, transform canvas={shift={(0.1mm,0.8mm)}}] {angle = B--A--C};
@stefan hey wow so schnell kann das gehen, danke! die bend-funktion beim füllen war mir nicht bekannt. Jetzt sehen lediglich die Winkel noch nicht entsprechend aus. Hast du da zufällig noch eine smarte Idee? oder Korrektur^^
(12 Okt '24, 16:19)
maqu
|
|
Ich würde versuchen, dies mit tikz-3dplot und einigen sphärischen Funktionen zu erreichen. Das ist ein bisschen kompliziert, aber hey, es funktioniert. Es wäre interessant, ein Paket für sphärische Winkel zu sehen. \documentclass[tikz, border=1cm]{standalone} \usepackage{tikz-3dplot} \newcommand{\sphereX}[2]{cos(#2)*cos(#1)} \newcommand{\sphereY}[2]{cos(#2)*sin(#1)} \newcommand{\sphereZ}[2]{sin(#2)} \newcommand{\polar}{60} \newcommand{\azimuth}{30} \newcommand{\rotated}{30} \begin{document} \tdplotsetmaincoords{\polar}{\azimuth} \begin{tikzpicture}[tdplot_main_coords] % Draw the base circle \draw[tdplot_screen_coords, ultra thin] (0,0) circle[radius=1]; % Set up rotated coordinates \tdplotsetrotatedcoords{\rotated}{\rotated}{\rotated} % Correct Viewing direction components \pgfmathsetmacro\viewdirX{\sphereX{-2*\azimuth}{90 - \polar}} \pgfmathsetmacro\viewdirY{\sphereY{-2*\azimuth}{90 - \polar}} \pgfmathsetmacro\viewdirZ{\sphereZ{-2*\azimuth}{90 - \polar}} % Longitudinal lines \foreach \Vnn in {0,90} { \tdplottransformrotmain{\sphereX{\Vnn}{0}}{\sphereY{\Vnn}{0}}{\sphereZ{\Vnn}{0}} \pgfmathsetmacro\lastx{\tdplotresx} \pgfmathsetmacro\lasty{\tdplotresy} \pgfmathsetmacro\lastz{\tdplotresz} \foreach \Vn in {5,10,...,360} { \tdplottransformrotmain{\sphereX{\Vnn}{\Vn}}{\sphereY{\Vnn}{\Vn}}{\sphereZ{\Vnn}{\Vn}} \pgfmathsetmacro\Vx{\tdplotresx} \pgfmathsetmacro\Vy{\tdplotresy} \pgfmathsetmacro\Vz{\tdplotresz} % Calculate the dot product \pgfmathsetmacro\currentDotProduct{\lastx*\viewdirX + \lasty*\viewdirY + \lastz*\viewdirZ} % Draw lines based on dot product \ifdim\currentDotProduct pt > 0 pt \draw[ultra thin] (\lastx,\lasty,\lastz) -- (\Vx,\Vy,\Vz); \else \draw[ultra thin,densely dotted] (\lastx,\lasty,\lastz) -- (\Vx,\Vy,\Vz); \fi % Update last coordinates \pgfmathsetmacro\lastx{\Vx} \pgfmathsetmacro\lasty{\Vy} \pgfmathsetmacro\lastz{\Vz} \global\let\lastx\lastx \global\let\lasty\lasty \global\let\lastz\lastz } } % Latitudinal lines \foreach \Vnn in {0} { \tdplottransformrotmain{\sphereX{0}{\Vnn}}{\sphereY{0}{\Vnn}}{\sphereZ{0}{\Vnn}} \pgfmathsetmacro\lastx{\tdplotresx} \pgfmathsetmacro\lasty{\tdplotresy} \pgfmathsetmacro\lastz{\tdplotresz} \foreach \Vn in {5,10,...,360} { \tdplottransformrotmain{\sphereX{\Vn}{\Vnn}}{\sphereY{\Vn}{\Vnn}}{\sphereZ{\Vn}{\Vnn}} \pgfmathsetmacro\Vx{\tdplotresx} \pgfmathsetmacro\Vy{\tdplotresy} \pgfmathsetmacro\Vz{\tdplotresz} % Calculate the dot product \pgfmathsetmacro\currentDotProduct{\lastx*\viewdirX + \lasty*\viewdirY + \lastz*\viewdirZ} % Draw lines based on dot product \ifdim\currentDotProduct pt > 0 pt \draw[ultra thin] (\lastx,\lasty,\lastz) -- (\Vx,\Vy,\Vz); \else \draw[ultra thin,densely dotted] (\lastx,\lasty,\lastz) -- (\Vx,\Vy,\Vz); \fi % Update last coordinates \pgfmathsetmacro\lastx{\Vx} \pgfmathsetmacro\lasty{\Vy} \pgfmathsetmacro\lastz{\Vz} \global\let\lastx\lastx \global\let\lasty\lasty \global\let\lastz\lastz } } % Draw the sphere last to ensure it's behind the lines \fill[tdplot_rotated_coords, smooth, variable=\Vt, red, domain=0:90,opacity=0.2] (0,0,1) coordinate (A) plot ({-sin(\Vt)},0,{cos(-\Vt)}) coordinate (B) plot ({-cos(\Vt)},{-sin(\Vt)},0) coordinate (C) plot (0,{-cos(\Vt)},{sin(\Vt)}); \fill[red,opacity=0.2] (A) -- (B) -- (C); \draw[smooth,domain=0:10,variable=\Vt,tdplot_rotated_coords] plot ({-\sphereX{\Vt}{10}},{-\sphereY{\Vt}{10}},{\sphereZ{\Vt}{10}}) plot ({-\sphereX{10}{10-\Vt}},{-\sphereY{10}{10-\Vt}},{\sphereZ{10}{10-\Vt}}); \node[tdplot_rotated_coords] at ({-\sphereX{15}{15}},{-\sphereY{15}{15}},{\sphereZ{15}{15}}) {$\scriptstyle\alpha$}; \draw[smooth,domain=0:10,variable=\Vt,tdplot_rotated_coords] plot ({\sphereX{\Vt+90}{10}},{-\sphereY{\Vt+90}{10}},{\sphereZ{\Vt+90}{10}}) plot ({\sphereX{100}{10-\Vt}},{-\sphereY{100}{10-\Vt}},{\sphereZ{100}{10-\Vt}}); \node[tdplot_rotated_coords] at ({-\sphereX{-15+90}{15}},{-\sphereY{-15+90}{15}},{\sphereZ{-15+90}{15}}) {$\scriptstyle\beta$}; \draw[smooth,domain=0:10,variable=\Vt,tdplot_rotated_coords] plot ({-\sphereY{\Vt}{10}},{-\sphereZ{\Vt}{10}},{\sphereX{\Vt}{10}}) plot ({-\sphereY{10}{10-\Vt}},{-\sphereZ{10}{10-\Vt}},{\sphereX{10}{10-\Vt}}); \node[tdplot_rotated_coords] at ({-\sphereY{15}{15}},{-\sphereZ{15}{15}},{\sphereX{15}{15}}) {$\scriptstyle\gamma$}; \end{tikzpicture} \end{document}
|

Da vielen Dank für den Tipp und die Chance das selbst zu fixen. Jetzt habe ich das mit dem Code schon einmal hinbekommen aber es gibt nicht das aus was bei mir rauskommt. Wenn ich das auch noch hinkriege wäre schön.^^
Wegen der Fläche, ich habe auch überlegt mit intersections zu arbeiten, aber alle möglichen Versuchen haben keine Ausgabe erzeugt.