
|
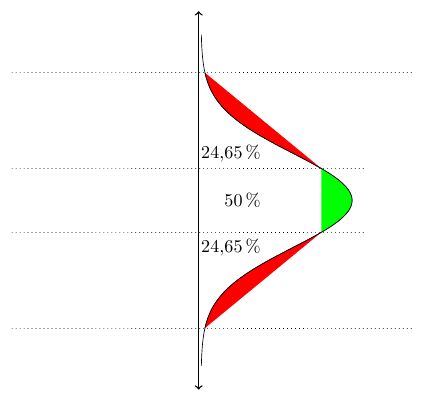
Ich habe eine um 270 Grad gedrehte Kurve der Normalverteilung in drei Abschnitte eingeteilt: 2 mal 24,65% und einmal 50%. Nun würde ich gerne die Abschnitte unter der Kurve mit zwei unterschiedlichen Farben füllen. Also bspw. den 50%-Abschnitt mit grün und die anderen beiden jeweils mit rot. Leider klappt das bei mir nicht, denn mit meiner Lösung werden entweder die Flächen nicht ganz gefüllt (grün) oder Sie werden oberhalb der Funktion gefüllt (rot). Im Minimalbeispiel sieht man meine Fehlversuche ganz gut. Ich würde mich sehr freuen, wenn jemand hier eine Idee hätte. \documentclass{scrbook} \usepackage[latin1]{inputenc} \usepackage[T1]{fontenc} \usepackage{lmodern} \usepackage{tikz} \tikzset{achse/.style={thick,color=black,->}} \usepackage{pgfplots} \pgfplotsset{compat=1.8} \begin{document} \begin{tikzpicture} [rotate=270] \draw [domain=-3.5:3.5, fill=none] plot[samples=600] function{8*1/sqrt(2*pi)*exp(-0.5*x**2)}; % Normalverteilung \draw [dotted](-0.6745,-4)--(-0.6745,3.5); \draw [dotted](0.6745,-4)--(0.6745,3.5); \draw [dotted](-2.698,-4)--(-2.698,4.5); \draw [dotted](2.698,-4)--(2.698,4.5); \node at (0,1.4) [anchor=east] {50\,\%}; % Beschriftung mit %-Angabe \node at (-1,1.4) [anchor=east] {24,65\,\%}; % Beschriftung mit %-Angabe \node at (1,1.4) [anchor=east] {24,65\,\%}; % Beschriftung mit %-Angabe \draw [achse,<->] (-4,-0.05) -- (4,-0.05); % Achse \draw [domain=-0.6745:0.6745, fill=green] plot[samples=600] function{8*1/sqrt(2*pi)*exp(-0.5*x**2)}; % Füllung der 50 % \draw [domain=-2.698:-0.6745, fill=red] plot[samples=600] function{8*1/sqrt(2*pi)*exp(-0.5*x**2)}; % Füllung der 24,65% \draw [domain=0.6745:2.698, fill=red] plot[samples=600] function{8*1/sqrt(2*pi)*exp(-0.5*x**2)}; % Füllung der 24,65% \end{tikzpicture} \end{document}
|
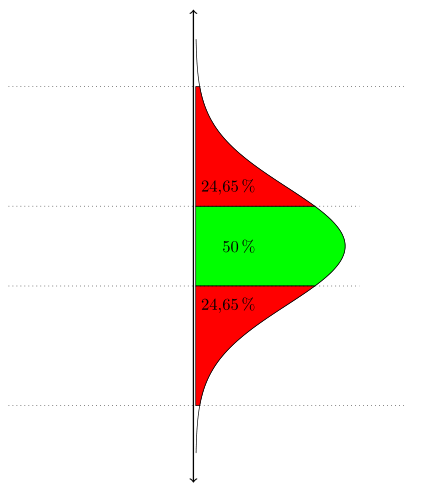
UpdateAb Version 1.10 von \documentclass[margin=5mm]{standalone} \usepackage{lmodern} \usepackage{pgfplots} \pgfplotsset{compat=1.10} \usepgfplotslibrary{fillbetween} \begin{document} \begin{tikzpicture} [rotate=270] \begin{axis}[ xmin=-4,xmax=4,ymin=-4, ymax=4.5, axis lines=none, xtick=\empty, height=10cm, domain=-3.5:3.5, ] \newcommand\PA{0.6745} \newcommand\PB{2.398} % Normalverteilung \addplot[name path=P,samples=600] gnuplot{8*1/sqrt(2*pi)*exp(-0.5*x**2)}; % Füllung \addplot[name path=X,draw=none]{0}; \addplot[red] fill between [of=P and X, soft clip={domain=-\PB:\PB}]; \addplot[green] fill between [of=P and X, soft clip={domain=-\PA:\PA}]; % spezielle Achse \draw[thick,<->](axis cs:-4,-.05)--(axis cs:4,-0.05); % zusätzliche Linien \draw [dotted](axis cs:-\PA,-4)--(axis cs:-\PA,3.5); \draw [dotted](axis cs:\PA,-4)--(axis cs:\PA,3.5); \draw [dotted](axis cs:-\PB,-4)--(axis cs:-\PB,4.5); \draw [dotted](axis cs:\PB,-4)--(axis cs:\PB,4.5); % Beschriftungen \node at (axis cs:0,1.4) [anchor=east,rotate=90] {50\,\%}; \node at (axis cs:-1,1.4) [anchor=east,rotate=90] {24,65\,\%}; \node at (axis cs:1,1.4) [anchor=east,rotate=90] {24,65\,\%}; \end{axis} \end{tikzpicture} \end{document}
Ursprüngliche Antwort: Da Du ohnehin \documentclass[margin=5mm]{standalone} \usepackage{lmodern} \usepackage{pgfplots} \pgfplotsset{compat=1.8} \begin{document} \begin{tikzpicture} [rotate=270] \begin{axis}[ xmin=-4,xmax=4,ymin=-4, ymax=4.5, axis lines=none, xtick=\empty, height=10cm ] % \newcommand*\plotfunc{8*1/sqrt(2*pi)*exp(-0.5*x**2)} \addplot [domain=-3.5:3.5,samples=600] gnuplot{\plotfunc}; % \addplot [domain=-0.6745:0.6745, fill=green,samples=600] gnuplot{\plotfunc} \closedcycle; % Füllung der 24,65 % \addplot[domain=-2.698:-0.6745, fill=red,samples=600] gnuplot{\plotfunc} \closedcycle; % Füllung der 50 % \addplot [domain=0.6745:2.698, fill=red,samples=600] gnuplot{\plotfunc} \closedcycle; % Füllung der 24,65 % % \draw[thick,<->](axis cs:-4,-.05)--(axis cs:4,-0.05); % \draw [dotted](axis cs:-0.6745,-4)--(axis cs:-0.6745,3.5); \draw [dotted](axis cs:0.6745,-4)--(axis cs:0.6745,3.5); \draw [dotted](axis cs:-2.698,-4)--(axis cs:-2.698,4.5); \draw [dotted](axis cs:2.698,-4)--(axis cs:2.698,4.5); \node at (axis cs:0,1.4) [anchor=east,rotate=90] {50\,\%}; \node at (axis cs:-1,1.4) [anchor=east,rotate=90] {24,65\,\%}; \node at (axis cs:1,1.4) [anchor=east,rotate=90] {24,65\,\%}; \end{axis} \end{tikzpicture} \end{document} Da die Frage sehr ähnlich zu Fläche unter Parabelast einfärben ist und du Danke vielmals. Die Lösung über closedcycle funktioniert fantastisch.
(26 Feb '14, 17:14)
josephine
|
|
Falls Du an einer elementaren Methode interessiert bist: Mein Trick hier war es, die samples unvernünftig hoch einzustellen (ohne das ging es nicht).
\documentclass[margin=5mm,tikz]{standalone} \usepackage[ngerman]{babel} \usetikzlibrary{patterns} \usepackage{amsmath} %========= \begin{document} %========= \begin{tikzpicture}[y=2cm, x=0.5cm, scale=2.5] %----------------------------- % x-Achse \draw[->, >=latex] (-3.25,0) -- (7.75,0) node[below] {$x$}; %Zwischenmaßstab auf x-Achse \foreach \k in {-1,1,3} \draw[shift={(\k*pi/2,0)},color=black] (0pt,1pt) -- (0pt,-1pt); %node[below] {\footnotesize $\frac{\k \pi}{2} $}; %Zahlen auf x-Achse %+PI \draw[shift={(pi,0)},color=black] (0pt,2pt) -- (0pt,-2pt) node[below] {\footnotesize $\pi$}; %-PI \draw[shift={(-pi,0)},color=black] (0pt,2pt) -- (0pt,-2pt) node[below] {\footnotesize $-\pi$}; %Weitere PI-Vielfache \foreach \k in {2} \draw[shift={(\k*pi,0)},color=black] (0pt,2pt) -- (0pt,-2pt) node[below] {\footnotesize $\k \pi$}; %----------------------------- % y-Achse \draw[->, >=latex] (0,-0.4) -- (0,1.5) node[left] {$y$};%node[above left] %Zahlen auf y-Achse \foreach \y in {-0.2,0.2,0.4,0.6,0.8,1.0,1.2} \draw[shift={(0,\y)},color=black] (2pt,0pt) -- (-2pt,0pt) node[left] {\footnotesize $\y$}; %Ursprung \draw[color=black] (0pt,-5pt) node[right] {\footnotesize $0$}; % Gitternetzlinien \draw[very thin, lightgray, xstep=pi/2, ystep=0.2] (-3.25,-0.35) grid (7.5,1.35); % ------------- %Funktion \draw[very thick,blue] plot[samples=200, domain=-pi-0.25pt:2*pi+0.55pt] (\x,{1/(2+sin(\x r))}) node[right] {\footnotesize $f(x) = \frac{1}{2 + \sin(x)}$}; %Schraffur \fill[red!80, postaction={pattern=north east lines}] plot[domain=0:2*pi, samples=500] (\x,{1/(2+sin(\x r))}) -- plot[domain=2*pi:0, samples=500] (\x,{0}); %Titel der Schraffur \draw[red] (4.5,0.3) -- (3.1,1.0) node[above=-5.5pt]{\footnotesize{$\int\limits_{0}^{2\pi} \frac{1}{2 + \sin(x)} dx$}}; \end{tikzpicture} %========= \end{document} %========= |
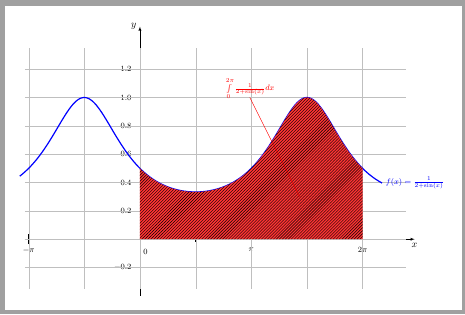

Das Beispiel verwendet das externe Programm
gnuplotund benötigt deshalb shell-escape bzw. enable-write18.