
|
Hallo liebe LaTeX-Freunde, ich versuche einen mittels
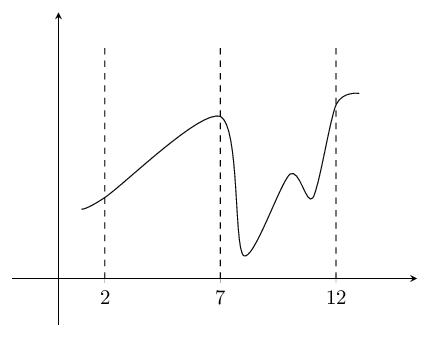
\documentclass[margin=2mm,tikz]{standalone}
\usepackage{tikz}
\usepackage{pgfplots}

\begin{document}

\begin{tikzpicture}
  \begin{axis}[
    axis equal image,
    axis lines=middle,
    xmin=-2, xmax=15.5, % Axis limits
    ymin=-2, ymax=11.5,
    xtick={2,7,12},
    ytick=\empty,
  ]
  \addplot[no marks, smooth, samples=500,]
                    coordinates{(1,3) (2,3.5)(7,7)(8,1)(10,4.5)(11,3.5) (12,7.5) (13,8)};
  %  \addplot[no marks, smooth, samples=500,red, restrict x to domain=2:7]
%                   coordinates{(1,3) (2,3.5)(7,7)(8,1)(10,4.5)(11,3.5) (12,7.5) (13,8)};
   % \addplot[no marks, smooth, samples=500,blue, restrict x to domain=7:12]
%               coordinates{(1,3) (2,3.5)(7,7)(8,1)(10,4.5)(11,3.5) (12,7.5) (13,8)};

    \draw[dashed](axis cs:2,0)--(axis cs:2,10);
    \draw[dashed](ax![alt text][2]is cs:7,0)--(axis cs:7,10);
    \draw[dashed](axis cs:12,0)--(axis cs:12,10);
  \end{axis}
\end{tikzpicture}
\end{document}
Im Intervall von 2 bis 7 soll nun mein Graph die Farbe Rot und im Intervall von 7 bis 12 die Farbe Blau annehmen.
Meine Idee war es mittels Hat hier jemand eine Idee die mich zum Ziel führt?
Dieser Frage ist "Community Wiki" markiert.
|
|
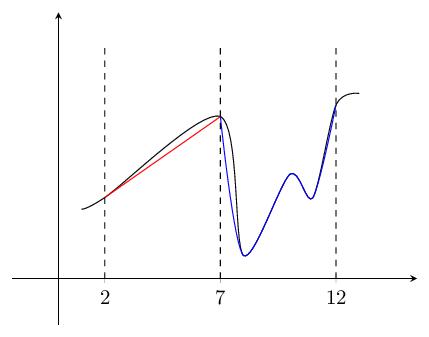
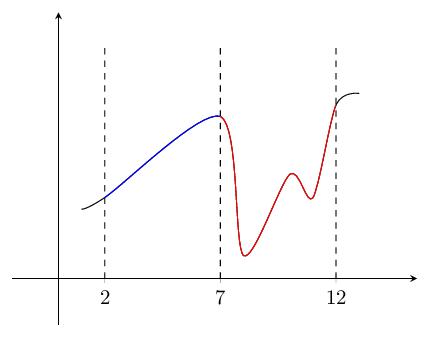
Okay, hab eine Lösung gefunden: \documentclass[margin=2mm,tikz]{standalone} \usepackage{tikz} \usepackage{pgfplots} \usetikzlibrary{intersections} \usepgfplotslibrary{fillbetween} \begin{document} \begin{tikzpicture} \begin{axis}[ axis equal image, axis lines=middle, xmin=-2, xmax=15.5, % Axis limits ymin=-2, ymax=11.5, xtick={2,7,12}, ytick=\empty, ] \addplot[no marks, smooth, samples=500,name path=f] coordinates{(1,3) (2,3.5)(7,7)(8,1)(10,4.5)(11,3.5) (12,7.5) (13,8)}; \draw[dashed, name path=i2](axis cs:2,0)--(axis cs:2,10); \draw[dashed, name path=i7](axis cs:7,0)--(axis cs:7,10); \draw[dashed, name path=i12](axis cs:12,0)--(axis cs:12,10); \path [ name path=f2, intersection segments={ of=i2 and f , sequence={B1} }]; \path [ draw,blue, name path=2to7, intersection segments={ of=f2 and i7 , sequence={A0} }]; \path [ name path=f7, intersection segments={ of=f2 and i7 , sequence={A1} }]; \path [ draw,red, name path=7to12, intersection segments={ of=f7 and i12 , sequence={A0} }]; \end{axis} \end{tikzpicture} \end{document}
|
|
Wie lässt sich der Graph einer Funktion in unterschiedliche Farben in MATLAB einteilen? @Matlab1 Wir sprechen hier über LaTeX, bei Matlab könntest Du auf gomatlab.de fragen.
(30 Jan '15, 20:45)
stefan ♦♦
|
