|
Hi, ich bin gerade dabei meine Uni-Unterlagen zu digitalisieren. Ich habe einige Grafiken erstellt bei denen ich Winkel eintragen möchte. Die Frage ist nicht völlig neu, aber alle bisher gefundenen Lösungen und Beispiele für ähnliche Fragen führen nicht zu Erfolg. Ich habe das Beispiel heute ein wenig (hoffentlich) übersichtlicher gestaltet. Die Struktur aller Grafiken ist fast deckungsgleich. Ich möchte gerne in der Lage sein, alle Winkel in den Abbildungen einzutragen. Gegeben ist hier ein Dreieck( in blau) das bereits wie gewünscht ist. Nun habe ich mithilfe ähnlicher Fragen aus diesem Forum und anderen Plattformen versucht eine Lösung zu finden. Diese haben unter anderem zu dem schwarzen Dreieck geführt. Mein Problem ist, dass ich die Winkel nicht korrekt positioniert bekomme. Ich vermute, dass es an dem Unterschied zwischen dem Koordinatensystem der Axis "Umgebung" und dem "anderen" Koordinatensystem liegen könnte. Das ist gerade mein erster Beitrag, darum war mein gestriges Minimalbeispiel nicht ganz optimal. Die Anmerkung, dass einige Pakete mehrfach geladen worden sind ist natürlich korrekt. Ich versuche das in meinem Arbeitsdokument zu ändern. Das ist alles neu für mich. Langfristig möchte ich eine Abbildung erstellen können, die der angehängten sehr ähnlich ist.
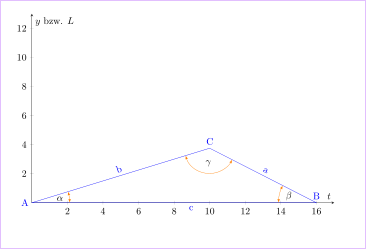
Ich hoffe der bearbeitete Beitrag ist besser nachvollziehbar. (vielen Dank für den Hinweis) Liebe Grüße Hans \documentclass{scrbook} \usepackage{amsmath} \usepackage[utf8]{inputenc} \usepackage[T1]{fontenc} \usepackage[ngerman]{babel} \usepackage{amsmath} \usepackage{amssymb} \usepackage{graphicx} \usepackage{pgfplots} \usetikzlibrary{angles,quotes,babel,3d} \usepackage{tkz-euclide} \usepgfplotslibrary{fillbetween} \pgfplotsset{width=7cm,compat=1.8} \usepackage{tikz} \usetikzlibrary{arrows,decorations.pathmorphing,backgrounds,positioning,fit,petri} \usetikzlibrary{positioning,arrows} \usetikzlibrary{shapes,backgrounds} \begin{document} \begin{figure}[h!] \begin{tikzpicture} \begin{axis}[ scale only axis=true, width= 12 cm , height= 7.5cm , name=axis6, below of=axis5 south, legend pos= outer north east, domain=0:6, xlabel=$t$, xmin=0.0, xmax=17, ylabel=$y bzw. L$, ymin=0, ymax=13, samples=300, axis y line=center, axis x line=middle, ] %Das wichtige Dreieck \addplot+[mark=none ,color=blue , ] coordinates {(0,0)(10,3.75) }; \addplot+[mark=none ,color=blue , ] coordinates {(16,0)(10,3.75) }; %Die Koordinaten, die den gesuchten Winkel bestimmen \end{axis} \draw (10,3.75) coordinate (a) node[right] {a} -- (16,0) coordinate (b) node[left] {b} -- (10,0) coordinate (c) node[above right] {c} pic["$\alpha$", draw=orange, <->, angle eccentricity=1.2, angle radius=1cm] {angle=a--b--c}; \end{tikzpicture} \end{figure} \end{document} |
|
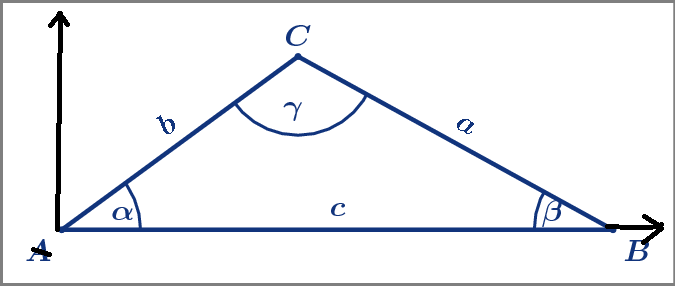
In dem MWE werden immer noch Pakete (u.a. Wenn Du \documentclass{scrbook} \usepackage{amsmath} \usepackage{pgfplots}% lädt auch tikz, graphicx, xcolor, ... \pgfplotsset{compat=1.16}% mindestens 1.11 und unbedingt vor allen anderen pgfplots Einstellungen setzen \usetikzlibrary{angles} \begin{document} \begin{tikzpicture} [>=latex]% damit orange Pfeile besser sichtbar \node[draw](axis5){Hier ist Axis5}; \begin{axis}[ scale only axis=true, width= 12 cm , height= 7.5cm , name=axis6, anchor=north, below of=axis5.south,% da fehlte der . legend pos= outer north east, domain=0:6, xlabel=$t$, xmin=0.0, xmax=17, ylabel=$y \text{ bzw. } L$, ymin=0, ymax=13, samples=300, axis lines=center, clip=false% <- damit die Zeichnung nicht an den Achsen abgeschnitten wird ] \path[draw=blue,text=blue,auto] (0,0)coordinate[label=left:A](A) -- node[sloped]{b} (10,3.75)coordinate[label=above:C](C) -- node[sloped]{a} (16,0)coordinate[label=above:B](B) --node[pos=.44]{c} cycle ; \pic[pic text=$\alpha$,draw=orange,<->,angle eccentricity=.75, angle radius=1.5cm]{angle=B--A--C}; \pic[pic text=$\beta$,draw=orange,<->,angle eccentricity=.75, angle radius=1.5cm]{angle=C--B--A}; \pic[pic text=$\gamma$,draw=orange,<->, angle radius=1cm]{angle=A--C--B}; \end{axis} \end{tikzpicture} \end{document}
Falls Du wirklich \path[draw=blue,text=blue,auto] (axis cs:0,0)coordinate[label=left:A](A) -- node[sloped]{b} (axis cs:10,3.75)coordinate[label=above:C](C) -- node[sloped]{a} (axis cs:16,0)coordinate[label=above:B](B) --node[pos=.44]{c} cycle ; Wenn Du \documentclass{scrbook} \usepackage{amsmath} \usepackage{pgfplots}% lädt auch tikz, graphicx, xcolor, ... \pgfplotsset{compat=1.16}% mindestens 1.11 und unbedingt vor allen anderen pgfplots Einstellungen setzen \usetikzlibrary{angles} \begin{document} \begin{tikzpicture} [>=latex]% damit orange Pfeile besser sichtbar \node[draw](axis5){Hier ist Axis5}; \begin{axis}[ scale only axis=true, width= 12 cm , height= 7.5cm , name=axis6, anchor=north, below of=axis5.south,% da fehlte der . legend pos= outer north east, domain=0:6, xlabel=$t$, xmin=0.0, xmax=17, ylabel=$y \text{ bzw. } L$, ymin=0, ymax=13, samples=300, axis lines=center ] \path[draw=blue,text=blue,auto] (0,0)coordinate(A) (10,3.75)coordinate(C) (16,0)coordinate(B) ; \end{axis} \path[draw=blue,text=blue,auto] (A)node[label=left:A]{} -- node[sloped]{b} (C)node[label=above:C]{} -- node[sloped]{a} (B)node[label=above:B]{} --node[pos=.44]{c} cycle ; \pic[pic text=$\alpha$,draw=orange,<->,angle eccentricity=.75, angle radius=1.5cm]{angle=B--A--C}; \pic[pic text=$\beta$,draw=orange,<->,angle eccentricity=.75, angle radius=1.5cm]{angle=C--B--A}; \pic[pic text=$\gamma$,draw=orange,<->, angle radius=1cm]{angle=A--C--B}; \end{tikzpicture} \end{document} Hey, Vielen Dank für deine Hilfe. Ich versuche mich gerade an den verschiedenen Versionen. Bereits der erste Vorschlag hat funktioniert. Ich habe mir an diesem Problem ordentlich die Zähne ausgebissen, dank deines Beitrages kann ich nun diese, vergangene und künftige Abbildungen besser ausarbeiten. Auch den anderen Details, die hier angesprochen worden sind werde ich mich weiter widmen. liebe Grüße Hans
(08 Apr '20, 13:07)
Hans
|