|
Kann ich den Koordinatenpunkt mit einem Rechteck, dessen Größe ich definiere ersetzen? Z.b. Länge 0.1/Höhe 0.12? \documentclass{article} \usepackage{tikz,pgfplots} \begin{document} \begin{tikzpicture} \begin{axis}[enlargelimits=0.2,colorbar] \addplot[ scatter,mark=square*,only marks, point meta=\thisrow{myvalue} ] table { x y myvalue 0.5 1 0.25 0.2 2 3 0.7 3 0.75 0.35 4 0.125 0.65 5 2 }; \end{axis} \end{tikzpicture} \end{document} |
|
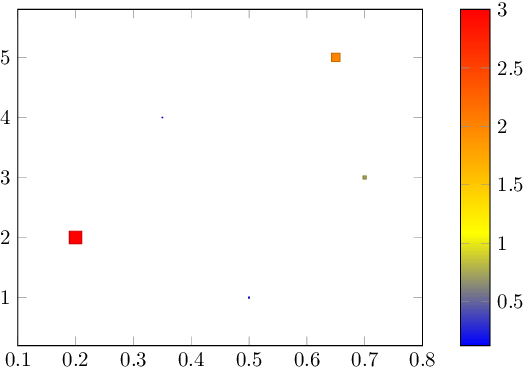
Ein sehr ähnliches Beispiel gibt es in der Dokumentation, siehe \documentclass{article} \usepackage{pgfplots} \begin{document} \begin{tikzpicture} \begin{axis}[enlargelimits=0.2,colorbar] \addplot[ scatter,mark=square*,only marks, point meta=\thisrow{myvalue}, visualization depends on= {\thisrow{myvalue} \as \perpointmarksize}, scatter/@pre marker code/.append style= {/tikz/mark size=\perpointmarksize} ] table { x y myvalue 0.5 1 0.25 0.2 2 3 0.7 3 0.75 0.35 4 0.125 0.65 5 2 }; \end{axis} \end{tikzpicture} \end{document}
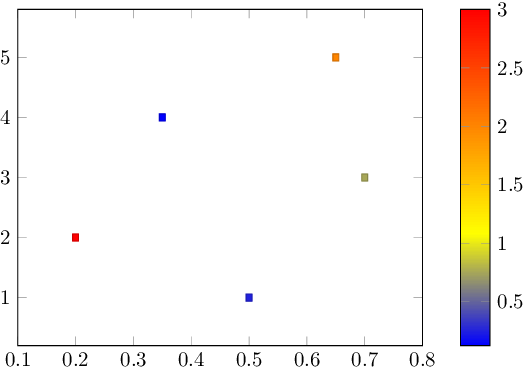
Wenn das nicht gemeint war, dann kann man leicht einen eigenen Plotmarker definieren. Man muss bei den Größen immer Einheiten mit angeben, ansonsten wird \documentclass{article} \usepackage{pgfplots} \newdimen\pgfplotmarkwidth \newdimen\pgfplotmarkheight \def\pgfsetplotmarkwidth#1{\pgfmathsetlength\pgfplotmarkwidth{#1}} \def\pgfsetplotmarkheight#1{\pgfmathsetlength\pgfplotmarkheight{#1}} \tikzoption{mark width}{\pgfsetplotmarkwidth{#1}} \tikzoption{mark height}{\pgfsetplotmarkheight{#1}} \pgfdeclareplotmark{rectangle}{% \pgfpathrectangle {\pgfqpoint{-.5\pgfplotmarkwidth}{-.5\pgfplotmarkheight}}% {\pgfqpoint{\pgfplotmarkwidth}{\pgfplotmarkheight}}% \pgfusepathqfillstroke } \begin{document} \begin{tikzpicture} \begin{axis}[enlargelimits=0.2,colorbar] \addplot[ scatter,mark=rectangle,only marks, mark width=0.1cm,mark height=0.12cm, point meta=\thisrow{myvalue} ] table { x y myvalue 0.5 1 0.25 0.2 2 3 0.7 3 0.75 0.35 4 0.125 0.65 5 2 }; \end{axis} \end{tikzpicture} \end{document}
@danke-schön bei verwendung von pgfplotsset{width=15cm,height=10cm} gibt es leider eine Abweichung um einige cm. (Wenn ich den Ausdruck per Lineal nach messe) Warum? bzw: begin{axis}[enlargelimits=0.2,colorbar, grid=major,width=12cm, height=16cm]
(25 Aug '16, 13:14)
Linux404
@Linux404 Das ist doch eher eine neue Frage? Hat nix mehr mit Rechtecken zu tun oder mit Henri's Beispiel. Poste es doch als neue Frage. Auch wenn sehr oft @Henri antwortet und er das (auch) hier sieht, ist es doch eine öffentliche Seite mit sortierter Archiv-Funktion, wo man nicht Fragen vermischen sollte. Danke!
(25 Aug '16, 13:21)
stefan ♦♦
ok ... werde ich machen... tut mir leid für das ständige stören
(25 Aug '16, 13:23)
Linux404
@Linux404 Diese Frage wurde bereits beantwortet: pgfplots: Wieso werden 'width' und 'height' nicht respektiert bzw. Graph zu klein ausgedruckt?
(25 Aug '16, 13:24)
Henri
|