|
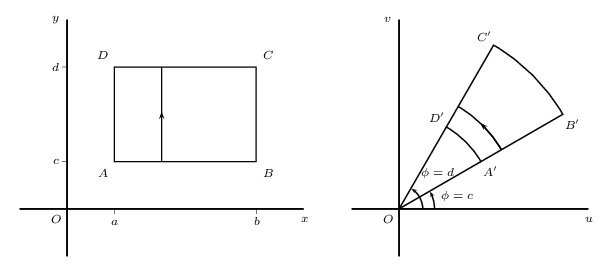
Ich möchte gerne Transformationen in der komplexen Ebene zeichnen.
Ich weiß nur nicht, wie ich das anstellen soll. Am besten sicherlich mit TikZ, aber jede andere Methode ist auch in Ordnung. |
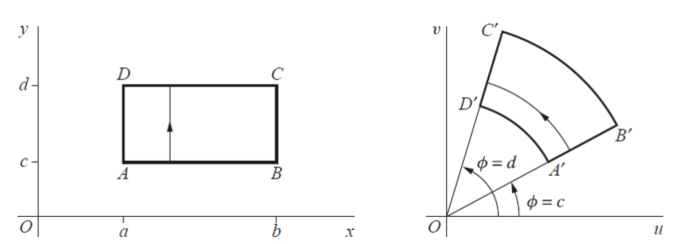
TikZDie Pfade mit Pfeilen drin brauchten ein wenig extra Arbeit, aber auf TeX.SX habe ich einen Weg gefunden. Für weitere Information kann man sich diesen Post ansehen: TeX.SX - TikZ: How to draw an arrow in the middle of the line? \documentclass[tikz]{standalone} \usetikzlibrary{decorations.markings} \tikzset{ arrow inside/.style = { postaction = { decorate, decoration={ markings, mark=at position 0.5 with {\arrow{>}} } } } } \begin{document} \begin{tikzpicture}[>=latex,scale=1.5] \begin{scope} % Axes \draw (0,0) node[below left] {$O$} (-0.5,0) -- (4,0) node[below] {$x$} (0,-0.5) -- (0,3) node[left] {$y$}; % Ticks \draw (1,0) -- (1,-0.1) node[below] {$a$} (3,0) -- (3,-0.1) node[below] {$b$} (0,1) -- (-0.1,1) node[left] {$c$} (0,2) -- (-0.1,2) node[left] {$d$}; % Square \draw[thick] (1,1) node[below left] {$A$} -- (3,1) node[below right] {$B$} -- (3,2) node[above right] {$C$} -- (1,2) node[above left] {$D$} -- cycle; \draw[arrow inside] (1.5,1) -- (1.5,2); \end{scope} \begin{scope}[xshift=6cm] % Axes \draw (0,0) node[below left] {$O$} (-0.5,0) -- (4,0) node[below] {$u$} (0,-0.5) -- (0,3) node[left] {$v$}; %Help Lines \draw (0,0) -- (30:3) (0,0) -- (70:3); % Angles \draw[->] (0.6,0) arc[start angle=0, end angle=70, radius=0.6] node[above right] {\small $\phi = d$}; \draw[->] (0.8,0) node[above right] {\small$\phi = c$} arc[start angle=0, end angle=30, radius=0.8]; % Transformation \draw[thick] (30:1.5) node[right] {$A'$} -- (30:3) node[below right] {$B'$} arc[start angle=30, end angle=70, radius=3] (70:3) node[above right] {$C'$} -- (70:1.5) node[above left] {$D'$} arc[start angle=70, end angle=30, radius=1.5]; \draw[arrow inside] (30:1.9) arc[start angle=30, end angle=70, radius=1.9]; \end{scope} \end{tikzpicture} \end{document} AsymptoteIm Rahmen des Wettbewerbs auf TeX.SX Showcase of translations to Asymptote from TikZ/PSTricks habe ich das Bild auf Asymptote portiert. \documentclass{standalone} \usepackage[inline]{asymptote} \begin{document} \begin{asy} import geometry; settings.outformat = "pdf"; unitsize(1.5cm); pen thick = linewidth(1.6pt); real x = 4.0, y = 3.0; real a = 1.0, b = 3.0, c = 1.0, d = 2.0; // Axes label("$O$", (0,0), align=SW); draw((-0.5,0) -- (x,0), L=Label("$x$", align=S, position=EndPoint)); draw((0,-0.5) -- (0,y), L=Label("$y$", align=W, position=EndPoint)); // Ticks draw((a,0) -- (a,-0.1), L=Label("$a$",align=S)); draw((b,0) -- (b,-0.1), L=Label("$b$",align=S)); draw((0,c) -- (-0.1,c), L=Label("$c$",align=W)); draw((0,d) -- (-0.1,d), L=Label("$d$",align=W)); // Square draw(box((a,c),(b,d)), p=thick); label("$A$", (a,c), align=SW); label("$B$", (b,c), align=SE); label("$C$", (b,d), align=NE); label("$D$", (a,d), align=NW); draw((a+0.5,c) -- (a+0.5,d), arrow=MidArrow()); currentpicture = shift(-6,0)*currentpicture; pair A = 1.5*dir(30), B = 3*dir(30), C = 3*dir(70), D = 1.5*dir(70); // Axes label("$O$", (0,0), align=SW); draw((-0.5,0) -- (x,0), L=Label("$u$", align=S, position=EndPoint)); draw((0,-0.5) -- (0,y), L=Label("$v$", align=W, position=EndPoint)); // Help Lines draw((0,0) -- B); draw((0,0) -- C); // Angles draw(arc((x,0),(0,0),D,0.6), L=Label("$\phi = d$", align=N+1.5E, position=EndPoint), arrow=ArcArrow()); draw(arc((x,0),(0,0),A,0.8), L=Label("$\phi = c$", align=E, position=MidPoint), arrow=ArcArrow()); // Transformation draw(A -- B -- arc(B,(0,0),C,3) -- C -- D -- arc(D,(0,0),A,1.5), p=thick); label("$A'$", A, align=SE); label("$B'$", B, align=SE); label("$C'$", C, align=NE); label("$D'$", D, align=NW); draw(arc(B,(0,0),C,1.9), arrow=MidArcArrow()); add(realpane.fit(),(0,0),W); add(complexpane.fit(),(0,0),E); \end{asy} \end{document} PSTricksNach dieser Antwort, des TeX.SX-Users, der ständig seinen Namen wechselt. \documentclass[pstricks,border=12pt]{standalone} \usepackage{pstricks-add,pst-eucl} \everypsbox{\scriptsize} \begin{document} \begin{pspicture}(-1,-1)(11,4) % Achsen ohne Skalierung und Markern \psaxes[ticks=none,labels=none](0,0)(-1,-1)(5,4)[$x$,-90][$y$,180] % Rechteck mit Markierungen \pstGeonode[PointSymbol=none,PosAngle={-135,-45,45,135},CurveType=polygon] (1,1){A}(4,1){B}(4,3){C}(1,3){D} % Linie mit Pfeil in der Mitte \psline[ArrowInside=->](2,1)(2,3) % Skala für die x-Achse \psset{ticksize=0pt -3pt} \psxTick(1){a} \psxTick(4){b} % Skala für die y-Achse \psset{ticksize=0pt -3pt} \psyTick(1){c} \psyTick(3){d} % Ursprung \uput[-135](0,0){$O$} \rput(7,0){ % Achsen ohne Skalierung und Markern \psaxes[ticks=none,labels=none](0,0)(-1,-1)(4,4)[$u$,-90][$v$,180] % Transformiertes Rechteck mit Markierungen \pstGeonode[PointSymbol=none,PosAngle={-45,-45,135,135}] (2;30){A'}(4;30){B'}(4;60){C'}(2;60){D'} \pscustom { \psline(A')(B') \psarc(0,0){4}{(B')}{(C')} \psline(C')(D') \psarcn(0,0){2}{(D')}{(A')} \closepath } % Winkel mit Pfeil in der Mitte \psarc(0,0){2.5}{(A')}{(D')} \psarc{->}(0,0){2.5}{(A')}{46.5}% trial and error approach! % Linie D'OA' \psline[linejoin=2](D')(0,0)(A') % Winkel mit Beschriftung \psset{arcsep=\pslinewidth,arrows=->,arrowscale=.75} \psarc(0,0){.5}{0}{(D')} \psarc(0,0){.75}{0}{(A')} \uput{.9}[15](0,0){$\phi=c$} \uput{.8}[51](0,0){$\phi=d$} % Ursprung \uput[-135](0,0){$O$} } \end{pspicture} \end{document} +100 Sehr schöne Umschau! So kann man auch die Syntax der Grafikpakete am Beispiel vergleichen.
(22 Mär '14, 14:07)
Student
|